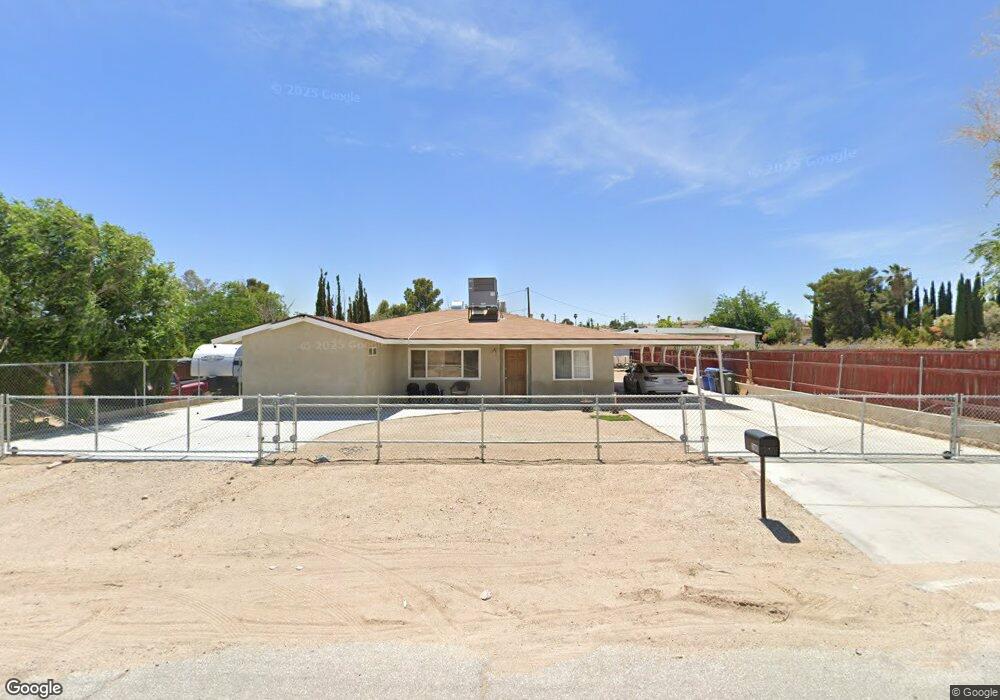
360 Windy Pass Barstow, CA 92311
Estimated Value: $184,000 - $266,000
4
Beds
1
Bath
1,368
Sq Ft
$170/Sq Ft
Est. Value
About This Home
This home is located at 360 Windy Pass, Barstow, CA 92311 and is currently estimated at $232,346, approximately $169 per square foot. 360 Windy Pass is a home located in San Bernardino County with nearby schools including Henderson Elementary School, Barstow Junior High School, and Barstow High School.
Ownership History
Date
Name
Owned For
Owner Type
Purchase Details
Closed on
Oct 29, 2019
Sold by
Sanchez Connie B
Bought by
Sanchez Stephen A and Sanchez Selena
Current Estimated Value
Home Financials for this Owner
Home Financials are based on the most recent Mortgage that was taken out on this home.
Original Mortgage
$52,000
Outstanding Balance
$45,655
Interest Rate
3.5%
Estimated Equity
$186,691
Purchase Details
Closed on
Nov 3, 1998
Sold by
Va
Bought by
Sanchez Connie B
Home Financials for this Owner
Home Financials are based on the most recent Mortgage that was taken out on this home.
Original Mortgage
$30,101
Interest Rate
6.54%
Mortgage Type
Seller Take Back
Purchase Details
Closed on
Jun 1, 1998
Sold by
First Mtg Corp
Bought by
Va
Purchase Details
Closed on
May 29, 1998
Sold by
Ferrel George and Ferrel Jill B
Bought by
First Mtg Corp
Purchase Details
Closed on
Oct 28, 1993
Sold by
Ferrel Jill B
Bought by
Ferrel George
Create a Home Valuation Report for This Property
The Home Valuation Report is an in-depth analysis detailing your home's value as well as a comparison with similar homes in the area
Home Values in the Area
Average Home Value in this Area
Purchase History
| Date | Buyer | Sale Price | Title Company |
|---|---|---|---|
| Sanchez Stephen A | $65,000 | Stewart Title Of Ca Inc | |
| Sanchez Connie B | $30,500 | First American Title Ins Co | |
| Va | -- | United Title Company | |
| First Mtg Corp | $47,317 | United Title Company | |
| Ferrel George | -- | -- |
Source: Public Records
Mortgage History
| Date | Status | Borrower | Loan Amount |
|---|---|---|---|
| Open | Sanchez Stephen A | $52,000 | |
| Previous Owner | Sanchez Connie B | $30,101 |
Source: Public Records
Tax History
| Year | Tax Paid | Tax Assessment Tax Assessment Total Assessment is a certain percentage of the fair market value that is determined by local assessors to be the total taxable value of land and additions on the property. | Land | Improvement |
|---|---|---|---|---|
| 2025 | $595 | $50,803 | $23,513 | $27,290 |
| 2024 | $584 | $49,807 | $23,052 | $26,755 |
| 2023 | $572 | $48,830 | $22,600 | $26,230 |
| 2022 | $569 | $47,873 | $22,157 | $25,716 |
| 2021 | $553 | $46,935 | $21,723 | $25,212 |
| 2020 | $553 | $46,453 | $21,500 | $24,953 |
| 2019 | $452 | $45,542 | $21,078 | $24,464 |
| 2018 | $471 | $44,649 | $20,665 | $23,984 |
| 2017 | $426 | $43,774 | $20,260 | $23,514 |
| 2016 | $419 | $42,916 | $19,863 | $23,053 |
| 2015 | $410 | $42,272 | $19,565 | $22,707 |
| 2014 | $405 | $41,444 | $19,182 | $22,262 |
Source: Public Records
Map
Nearby Homes
- 1230 Prairie Dr
- 0 2nd St
- 20 Rimrock Rd
- 1131 Barstow Rd
- 541 Windy Pass
- 2065 Barcelona Cir
- 0 Armory Rd Unit HD25232376
- 0 Armory Rd Unit HD24113363
- 2050 Dartmouth Ct
- 620 Starlight St
- 11 Off of the 247
- N 1/2NW 1/4NW 1 N 1 2nw 1 4nw 1 4 Sw 1 4 Ne1 4 Section 12 Tp 9n R Unit lot
- 0 Off Highway 58
- 1061 May Ln
- 1071 May Ln
- 1050 Arroyo Dr
- 2150 Ruby Dr
- 0 Emerald St
- 1260 Mirage Dr
- 824 S 2nd Ave
Your Personal Tour Guide
Ask me questions while you tour the home.