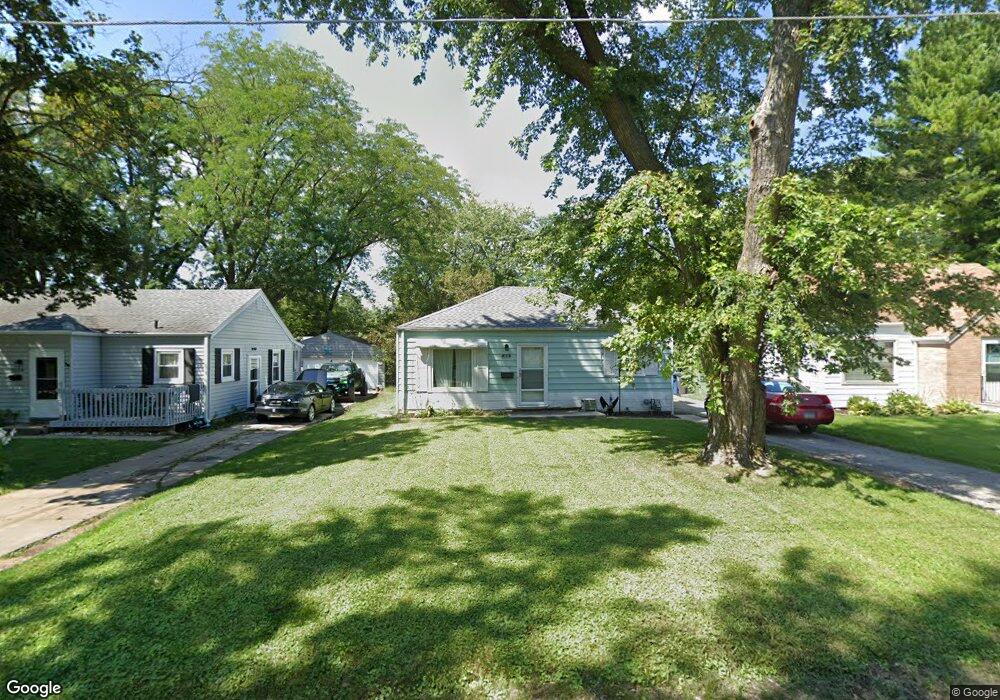
3600 37th St Des Moines, IA 50310
Beaverdale NeighborhoodEstimated Value: $150,000 - $202,000
2
Beds
1
Bath
916
Sq Ft
$198/Sq Ft
Est. Value
About This Home
This home is located at 3600 37th St, Des Moines, IA 50310 and is currently estimated at $181,193, approximately $197 per square foot. 3600 37th St is a home located in Polk County with nearby schools including Moore Elementary School, Meredith Middle School, and Hoover High School.
Ownership History
Date
Name
Owned For
Owner Type
Purchase Details
Closed on
Dec 30, 2021
Sold by
Kitterman Darron Todd
Bought by
Mba Growth Llc
Current Estimated Value
Purchase Details
Closed on
Dec 27, 2021
Sold by
Kitterman Cassie Jo
Bought by
Kitterman Darron Todd
Purchase Details
Closed on
May 3, 2006
Sold by
Hall Robert W and Hall Donald A
Bought by
Kitterman Darron and Kitterman Cassie
Home Financials for this Owner
Home Financials are based on the most recent Mortgage that was taken out on this home.
Original Mortgage
$82,650
Interest Rate
6.5%
Mortgage Type
Purchase Money Mortgage
Create a Home Valuation Report for This Property
The Home Valuation Report is an in-depth analysis detailing your home's value as well as a comparison with similar homes in the area
Home Values in the Area
Average Home Value in this Area
Purchase History
| Date | Buyer | Sale Price | Title Company |
|---|---|---|---|
| Mba Growth Llc | -- | None Available | |
| Kitterman Darron Todd | -- | None Available | |
| Kitterman Darron | $86,500 | None Available |
Source: Public Records
Mortgage History
| Date | Status | Borrower | Loan Amount |
|---|---|---|---|
| Previous Owner | Kitterman Darron | $82,650 | |
| Closed | Mba Growth Llc | $0 |
Source: Public Records
Tax History Compared to Growth
Tax History
| Year | Tax Paid | Tax Assessment Tax Assessment Total Assessment is a certain percentage of the fair market value that is determined by local assessors to be the total taxable value of land and additions on the property. | Land | Improvement |
|---|---|---|---|---|
| 2025 | $3,166 | $174,800 | $40,000 | $134,800 |
| 2024 | $3,166 | $160,900 | $36,200 | $124,700 |
| 2023 | $3,122 | $160,900 | $36,200 | $124,700 |
| 2022 | $2,890 | $132,500 | $31,300 | $101,200 |
| 2021 | $2,832 | $132,500 | $31,300 | $101,200 |
| 2020 | $2,938 | $122,100 | $28,700 | $93,400 |
| 2019 | $2,690 | $122,100 | $28,700 | $93,400 |
| 2018 | $2,658 | $108,600 | $25,100 | $83,500 |
| 2017 | $2,464 | $108,600 | $25,100 | $83,500 |
| 2016 | $2,394 | $99,600 | $22,400 | $77,200 |
| 2015 | $2,394 | $99,600 | $22,400 | $77,200 |
| 2014 | $2,060 | $86,200 | $20,200 | $66,000 |
Source: Public Records
Map
Nearby Homes
- 3616 37th St
- 3711 37th St
- 3905 Clinton Ave
- 3833 38th St
- 3605 Davisson Rd
- 4004 Clinton Ave
- 3831 40th St
- 3846 Lower Beaver Rd
- 4037 Amick Ave
- 4008 Douglas Ave
- 3514 Davisson Rd
- 3945 38th St
- 4020 Douglas Ave
- 3616 Madison Ave
- 3301 34th St
- 3711 Adams Ave
- 3913 Lawnwoods Dr
- 4015 39th Place
- 3015 Seneca Ave
- 3405 30th St