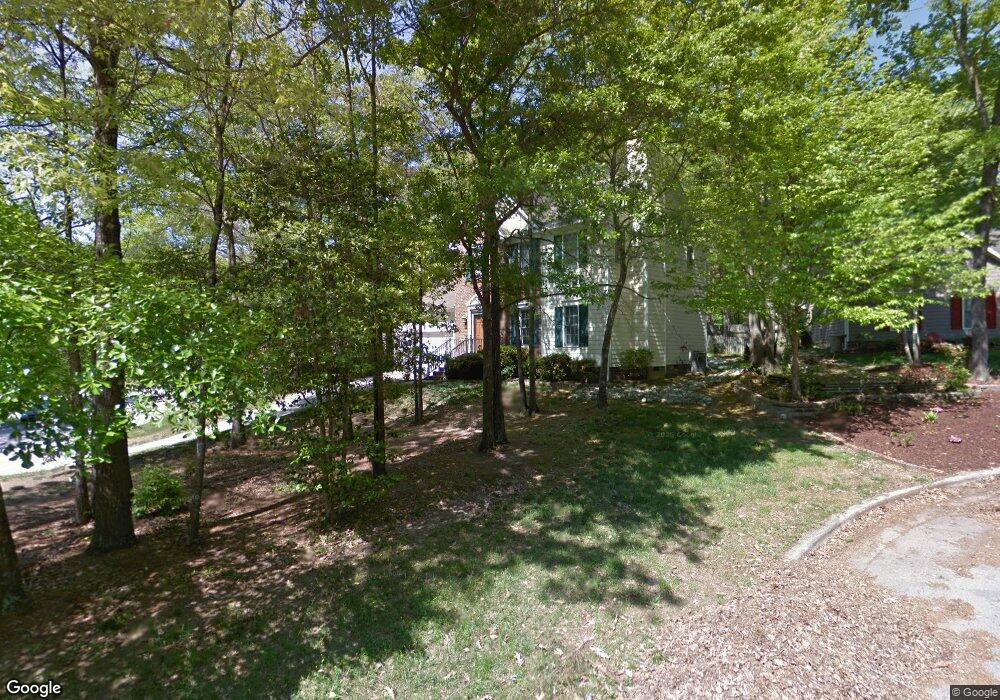
3601 Cadler Ct Raleigh, NC 27616
Forestville NeighborhoodEstimated Value: $329,000 - $361,000
3
Beds
3
Baths
1,518
Sq Ft
$229/Sq Ft
Est. Value
About This Home
This home is located at 3601 Cadler Ct, Raleigh, NC 27616 and is currently estimated at $347,546, approximately $228 per square foot. 3601 Cadler Ct is a home located in Wake County with nearby schools including Harris Creek Elementary School, Rolesville Middle School, and Rolesville High School.
Ownership History
Date
Name
Owned For
Owner Type
Purchase Details
Closed on
Oct 19, 2015
Sold by
Falkowski Ronald E and Falkowski Susan K
Bought by
Cronk Leslie C
Current Estimated Value
Purchase Details
Closed on
Jun 11, 2010
Sold by
Webster Benjamin A and Andersen Corinne E
Bought by
Falkowski Ronald E and Falkowski Susan K
Home Financials for this Owner
Home Financials are based on the most recent Mortgage that was taken out on this home.
Original Mortgage
$170,701
Interest Rate
3.5%
Mortgage Type
FHA
Purchase Details
Closed on
Jul 30, 2004
Sold by
Burnette Earl L and Burnette Susan J
Bought by
Webster Benjamin A and Andersen Corinne E
Home Financials for this Owner
Home Financials are based on the most recent Mortgage that was taken out on this home.
Original Mortgage
$138,000
Interest Rate
6.24%
Mortgage Type
Purchase Money Mortgage
Create a Home Valuation Report for This Property
The Home Valuation Report is an in-depth analysis detailing your home's value as well as a comparison with similar homes in the area
Home Values in the Area
Average Home Value in this Area
Purchase History
| Date | Buyer | Sale Price | Title Company |
|---|---|---|---|
| Cronk Leslie C | $175,000 | Attorney | |
| Falkowski Ronald E | $173,000 | None Available | |
| Webster Benjamin A | $138,000 | -- |
Source: Public Records
Mortgage History
| Date | Status | Borrower | Loan Amount |
|---|---|---|---|
| Previous Owner | Falkowski Ronald E | $170,701 | |
| Previous Owner | Webster Benjamin A | $138,000 |
Source: Public Records
Tax History Compared to Growth
Tax History
| Year | Tax Paid | Tax Assessment Tax Assessment Total Assessment is a certain percentage of the fair market value that is determined by local assessors to be the total taxable value of land and additions on the property. | Land | Improvement |
|---|---|---|---|---|
| 2025 | $3,224 | $367,347 | $110,000 | $257,347 |
| 2024 | $3,210 | $367,347 | $110,000 | $257,347 |
| 2023 | $2,277 | $207,087 | $50,000 | $157,087 |
| 2022 | $2,117 | $207,087 | $50,000 | $157,087 |
| 2021 | $2,035 | $207,087 | $50,000 | $157,087 |
| 2020 | $1,998 | $207,087 | $50,000 | $157,087 |
| 2019 | $1,913 | $163,375 | $42,000 | $121,375 |
| 2018 | $1,805 | $163,375 | $42,000 | $121,375 |
| 2017 | $1,720 | $163,375 | $42,000 | $121,375 |
| 2016 | -- | $163,375 | $42,000 | $121,375 |
| 2015 | $1,699 | $162,107 | $42,000 | $120,107 |
| 2014 | $1,612 | $162,107 | $42,000 | $120,107 |
Source: Public Records
Map
Nearby Homes
- 3600 Cadler Ct
- 3617 Culater Ct
- 3609 Singleleaf Ln
- 3421 Tunas St
- 8005 Mill Bluff Ct
- 7916 Mandrel Way
- 3605 Iron Sight Ct
- 8213 Round Oak Rd
- 3348 Daingerfield Dr
- 3527 Hamilton Mill Dr
- 8005 Caliber Woods Dr
- 3205 Suncrest Village Ln
- 8117 Bright Oak Trail
- 6405 Grassy Knoll Ln
- 4132 Breadfruit Ct
- 7528 Argent Valley Dr
- 3626 Jordan Mill Ct
- 7604 Brighton Village Dr
- 3616 Dewing Dr
- 4018 Rothfield Ln
- 3600 Norway Ct
- 3605 Cadler Ct
- 3604 Norway Ct
- 3608 Cadler Ct
- 3524 Tunas St
- 3520 Tunas St
- 3604 Cadler Ct
- 3608 Norway Ct
- 3516 Singleleaf Ln
- 3528 Singleleaf Ln
- 3528 Tunas St
- 3516 Tunas St
- 3524 Singleleaf Ln
- 3520 Singleleaf Ln
- 3512 Singleleaf Ln
- 3601 Norway Ct
- 3532 Singleleaf Ln
- 3533 Tunas St
- 3532 Tunas St
- 3508 Singleleaf Ln