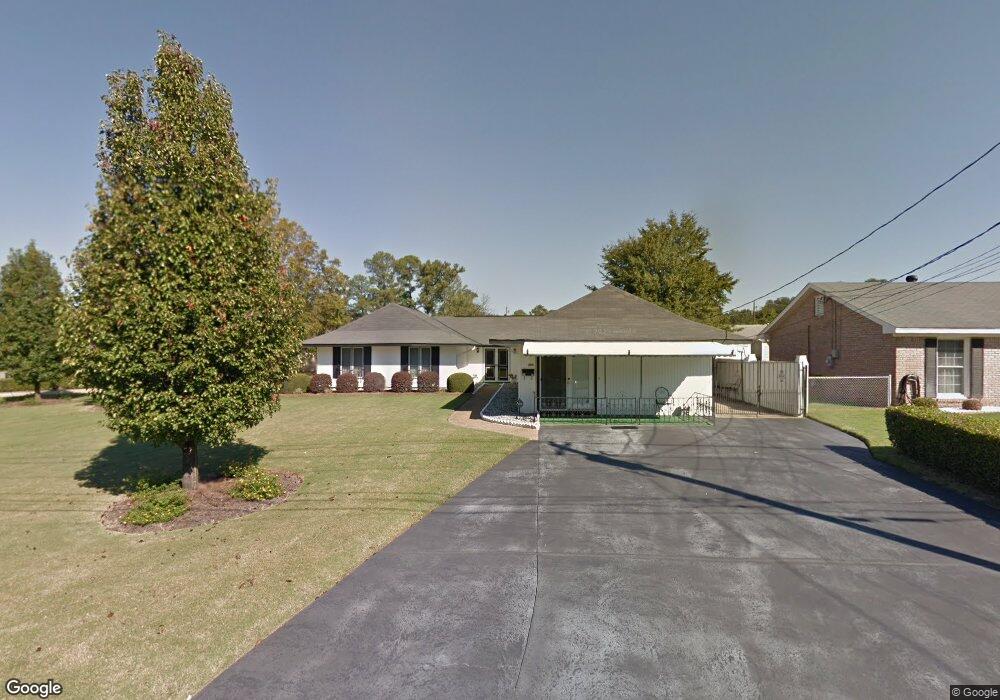
3601 Caspian Dr Columbus, GA 31906
Eastern Columbus NeighborhoodEstimated Value: $205,000 - $266,000
3
Beds
3
Baths
2,336
Sq Ft
$97/Sq Ft
Est. Value
About This Home
This home is located at 3601 Caspian Dr, Columbus, GA 31906 and is currently estimated at $226,728, approximately $97 per square foot. 3601 Caspian Dr is a home located in Muscogee County with nearby schools including St. Mary's Road Magnet Academy, Baker Middle School, and Spencer High School.
Ownership History
Date
Name
Owned For
Owner Type
Purchase Details
Closed on
May 30, 2024
Sold by
Ponder Yvette Owens
Bought by
Dorsett Jason
Current Estimated Value
Home Financials for this Owner
Home Financials are based on the most recent Mortgage that was taken out on this home.
Original Mortgage
$172,000
Outstanding Balance
$169,867
Interest Rate
7.17%
Mortgage Type
New Conventional
Estimated Equity
$56,861
Purchase Details
Closed on
May 20, 2024
Sold by
Hart Annie O
Bought by
Ponder Yvette Owens
Home Financials for this Owner
Home Financials are based on the most recent Mortgage that was taken out on this home.
Original Mortgage
$172,000
Outstanding Balance
$169,867
Interest Rate
7.17%
Mortgage Type
New Conventional
Estimated Equity
$56,861
Purchase Details
Closed on
Jan 28, 2009
Sold by
Ponder Yvette Owens and Hart Annie O
Bought by
Hart Annie O and Ponder Yvette Owens
Create a Home Valuation Report for This Property
The Home Valuation Report is an in-depth analysis detailing your home's value as well as a comparison with similar homes in the area
Home Values in the Area
Average Home Value in this Area
Purchase History
| Date | Buyer | Sale Price | Title Company |
|---|---|---|---|
| Dorsett Jason | $215,000 | None Listed On Document | |
| Ponder Yvette Owens | -- | None Listed On Document | |
| Hart Annie O | -- | None Available |
Source: Public Records
Mortgage History
| Date | Status | Borrower | Loan Amount |
|---|---|---|---|
| Open | Dorsett Jason | $172,000 |
Source: Public Records
Tax History Compared to Growth
Tax History
| Year | Tax Paid | Tax Assessment Tax Assessment Total Assessment is a certain percentage of the fair market value that is determined by local assessors to be the total taxable value of land and additions on the property. | Land | Improvement |
|---|---|---|---|---|
| 2025 | $3,203 | $81,816 | $6,928 | $74,888 |
| 2024 | -- | $70,464 | $6,928 | $63,536 |
| 2023 | $291 | $70,464 | $6,928 | $63,536 |
| 2022 | $1,021 | $32,944 | $6,928 | $26,016 |
| 2021 | $1,014 | $50,164 | $6,928 | $43,236 |
| 2020 | $1,015 | $50,164 | $6,928 | $43,236 |
| 2019 | $1,020 | $50,164 | $6,928 | $43,236 |
| 2018 | $1,020 | $50,164 | $6,928 | $43,236 |
| 2017 | $1,025 | $50,164 | $6,928 | $43,236 |
| 2016 | $1,030 | $68,335 | $4,987 | $63,348 |
| 2015 | $1,033 | $68,335 | $4,987 | $63,348 |
| 2014 | $1,036 | $68,335 | $4,987 | $63,348 |
| 2013 | -- | $68,335 | $4,987 | $63,348 |
Source: Public Records
Map
Nearby Homes
- 130 Sycamore Ct
- 3711 Youmans St
- 229 N Oakley Dr
- 716 Benning Dr
- 917 Fletcher Ave
- 3815 Baker Plaza Dr
- 1025 Fletcher Ave
- 3522 Youmans St
- 810 Winston Rd
- 824 Winston Rd
- 906 Winston Rd
- 929 Winston Rd
- 4163 Swann St
- 4408 Ridgefield Dr
- 3589 Irwin Way
- 920 Brooks Rd
- 1234 Hanover Ave
- 4422 Debolt Ct
- 4026 Bowman St
- 4437 St Marys Rd
- 3609 Caspian Dr
- 3602 Montrose Dr
- 3610 Montrose Dr
- 3618 Montrose Dr
- 3615 Caspian Dr
- 3606 Caspian Dr
- 105 Whippoorwill Ln
- 3612 Caspian Dr
- 107 Whippoorwill Ln
- 3624 Montrose Dr
- 3621 Caspian Dr
- 109 Whippoorwill Ln
- 3618 Caspian Dr
- 3601 Montrose Dr
- 3630 Montrose Dr
- 111 Whippoorwill Ln
- 3607 Montrose Dr
- 3613 Montrose Dr
- 3624 Caspian Dr
- 3627 Caspian Dr