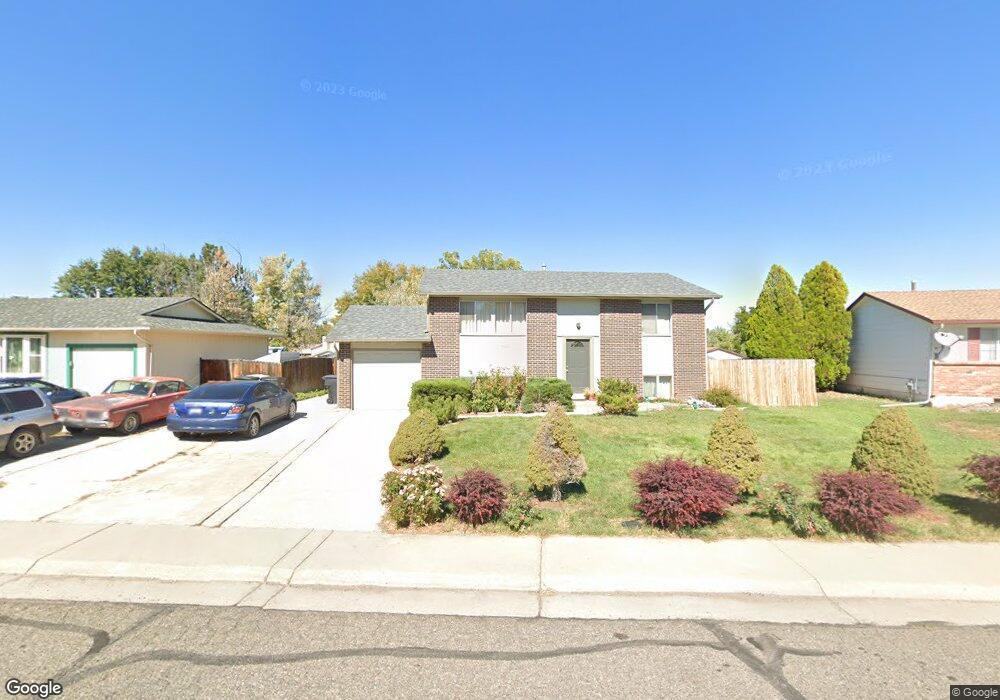
3601 E 122nd Ave Thornton, CO 80241
Northaven NeighborhoodEstimated Value: $431,824 - $495,000
4
Beds
1
Bath
1,768
Sq Ft
$262/Sq Ft
Est. Value
About This Home
This home is located at 3601 E 122nd Ave, Thornton, CO 80241 and is currently estimated at $462,956, approximately $261 per square foot. 3601 E 122nd Ave is a home located in Adams County with nearby schools including Stellar Elementary School, Century Middle School, and Mountain Range High School.
Ownership History
Date
Name
Owned For
Owner Type
Purchase Details
Closed on
Oct 22, 2007
Sold by
Desalvo Connie
Bought by
Desalvo Connie and Desalvo Andrew J
Current Estimated Value
Home Financials for this Owner
Home Financials are based on the most recent Mortgage that was taken out on this home.
Original Mortgage
$186,100
Interest Rate
6.38%
Mortgage Type
New Conventional
Purchase Details
Closed on
Jul 26, 2004
Sold by
Desalvo Connie Jean
Bought by
Desalvo Connie
Home Financials for this Owner
Home Financials are based on the most recent Mortgage that was taken out on this home.
Original Mortgage
$168,000
Interest Rate
7.8%
Mortgage Type
New Conventional
Purchase Details
Closed on
Apr 6, 2000
Sold by
And Desalvo Daniel James and And Jean De
Bought by
Desalvo Connie Jean
Home Financials for this Owner
Home Financials are based on the most recent Mortgage that was taken out on this home.
Original Mortgage
$105,000
Interest Rate
8.27%
Create a Home Valuation Report for This Property
The Home Valuation Report is an in-depth analysis detailing your home's value as well as a comparison with similar homes in the area
Home Values in the Area
Average Home Value in this Area
Purchase History
| Date | Buyer | Sale Price | Title Company |
|---|---|---|---|
| Desalvo Connie | -- | Ccts | |
| Desalvo Connie | -- | Ct | |
| Desalvo Connie Jean | -- | -- |
Source: Public Records
Mortgage History
| Date | Status | Borrower | Loan Amount |
|---|---|---|---|
| Closed | Desalvo Connie | $186,100 | |
| Closed | Desalvo Connie | $168,000 | |
| Closed | Desalvo Connie Jean | $105,000 |
Source: Public Records
Tax History
| Year | Tax Paid | Tax Assessment Tax Assessment Total Assessment is a certain percentage of the fair market value that is determined by local assessors to be the total taxable value of land and additions on the property. | Land | Improvement |
|---|---|---|---|---|
| 2025 | $2,697 | $28,220 | $5,580 | $22,640 |
| 2024 | $2,697 | $25,940 | $5,130 | $20,810 |
| 2023 | $2,669 | $29,770 | $5,550 | $24,220 |
| 2022 | $2,324 | $21,100 | $5,700 | $15,400 |
| 2021 | $2,401 | $21,100 | $5,700 | $15,400 |
| 2020 | $2,174 | $19,490 | $5,860 | $13,630 |
| 2019 | $2,179 | $19,490 | $5,860 | $13,630 |
| 2018 | $2,017 | $17,530 | $6,260 | $11,270 |
| 2017 | $1,834 | $17,530 | $6,260 | $11,270 |
| 2016 | $1,617 | $15,050 | $3,580 | $11,470 |
| 2015 | $1,615 | $15,050 | $3,580 | $11,470 |
| 2014 | $1,293 | $11,710 | $2,630 | $9,080 |
Source: Public Records
Map
Nearby Homes
- 3991 E 121st Ave
- 12251 Cook Ct
- 12237 Cook Ct
- 12312 Colorado Blvd Unit 10
- 12332 Colorado Blvd Unit 30
- 12218 Adams St
- 3225 E 124th Ave
- 12458 Albion St
- 11909 Monroe St
- 12672 Madison Ct
- 3491 E 119th St
- 11961 Bellaire St Unit C
- 11981 Bellaire St Unit D
- 12711 Colorado Blvd Unit 108A
- 12711 Colorado Blvd Unit 314C
- 11867 Jackson Cir
- 4465 E 122nd Ave
- 4205 E 119th Place Unit C
- 4145 E 119th Place Unit B
- 3715 E 127th Way
- 3561 E 122nd Ave
- 3621 E 122nd Ave
- 12217 Monroe Place
- 12216 Monroe Place
- 3531 E 122nd Ave
- 3651 E 122nd Ave
- 3600 E 122nd Ave
- 3590 E 122nd Ave
- 12226 Monroe Place
- 12227 Monroe Place
- 3640 E 122nd Ave
- 3570 E 122nd Ave
- 3671 E 122nd Ave
- 12225 Garfield Place
- 3660 E 122nd Ave
- 3550 E 122nd Ave
- 12236 Monroe Place
- 12237 Monroe Place
- 12228 Monroe Dr
- 3530 E 122nd Ave
Your Personal Tour Guide
Ask me questions while you tour the home.