Estimated Value: $126,000 - $153,000
3
Beds
1
Bath
1,575
Sq Ft
$88/Sq Ft
Est. Value
About This Home
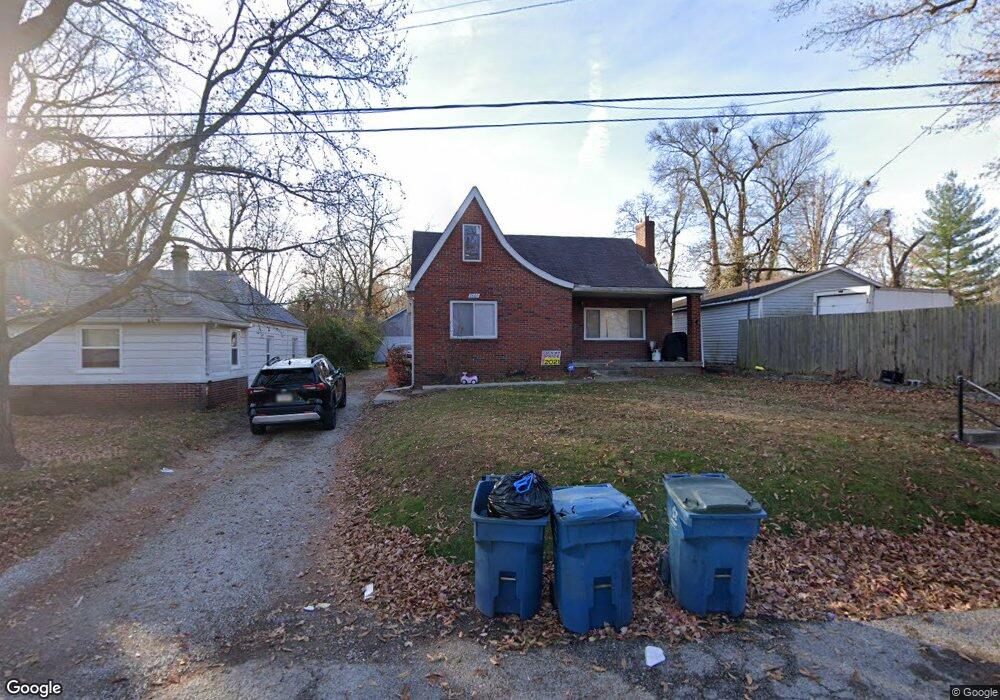
This home is located at 3601 E Doerr Ave, Alton, IL 62002 and is currently estimated at $138,038, approximately $87 per square foot. 3601 E Doerr Ave is a home located in Madison County with nearby schools including East Elementary School, Alton Middle School, and Alton High School.
Ownership History
Date
Name
Owned For
Owner Type
Purchase Details
Closed on
Dec 22, 2021
Sold by
Simon James K and Simon Terri L
Bought by
Jlh Property Investments Llc
Current Estimated Value
Home Financials for this Owner
Home Financials are based on the most recent Mortgage that was taken out on this home.
Original Mortgage
$102,850
Outstanding Balance
$94,595
Interest Rate
3.11%
Mortgage Type
New Conventional
Estimated Equity
$43,443
Purchase Details
Closed on
Dec 16, 2021
Sold by
Jlh Property Investments Llc
Bought by
Le Duc and Le Jillian
Home Financials for this Owner
Home Financials are based on the most recent Mortgage that was taken out on this home.
Original Mortgage
$102,850
Outstanding Balance
$94,595
Interest Rate
3.11%
Mortgage Type
New Conventional
Estimated Equity
$43,443
Purchase Details
Closed on
Oct 24, 2011
Sold by
Rich Eldon G
Bought by
Simon James K and Simon Terri L
Create a Home Valuation Report for This Property
The Home Valuation Report is an in-depth analysis detailing your home's value as well as a comparison with similar homes in the area
Home Values in the Area
Average Home Value in this Area
Purchase History
| Date | Buyer | Sale Price | Title Company |
|---|---|---|---|
| Jlh Property Investments Llc | $110,000 | Community Title & Escrow | |
| Le Duc | $121,000 | None Available | |
| Simon James K | $35,000 | Mctc |
Source: Public Records
Mortgage History
| Date | Status | Borrower | Loan Amount |
|---|---|---|---|
| Open | Le Duc | $102,850 |
Source: Public Records
Tax History
| Year | Tax Paid | Tax Assessment Tax Assessment Total Assessment is a certain percentage of the fair market value that is determined by local assessors to be the total taxable value of land and additions on the property. | Land | Improvement |
|---|---|---|---|---|
| 2024 | $2,557 | $31,450 | $1,970 | $29,480 |
| 2023 | $2,557 | $28,400 | $1,780 | $26,620 |
| 2022 | $2,402 | $25,670 | $1,610 | $24,060 |
| 2021 | $2,210 | $24,120 | $1,510 | $22,610 |
| 2020 | $2,158 | $23,260 | $1,460 | $21,800 |
| 2019 | $2,232 | $22,730 | $1,430 | $21,300 |
| 2018 | $2,173 | $22,140 | $1,390 | $20,750 |
| 2017 | $1,876 | $19,390 | $1,390 | $18,000 |
| 2016 | $1,839 | $19,390 | $1,390 | $18,000 |
| 2015 | $1,748 | $19,390 | $1,390 | $18,000 |
| 2014 | $1,748 | $19,390 | $1,390 | $18,000 |
| 2013 | $1,748 | $19,920 | $1,430 | $18,490 |
Source: Public Records
Map
Nearby Homes
- 1407 Doerr Ave
- 3538 Berkeley Ave
- 202 Wisconsin Ave
- 3505 Coronado Dr
- 1429 S Rodgers Ave
- 3701 Coronado Dr
- 3625 Horn Ave
- 3421 Badley Ave
- 1416 Milton Rd
- 3311 Sherman St
- 3310 Leroy Ave
- 3305 Fernwood Ave
- 1629 S Rodgers Ave
- 3528 Oscar Ave
- 3400 Milton Dr
- 3502 Oscar Ave
- 3516 Omega St
- 3413 Milton Dr
- 3317 Jackson St
- 1000 Willard Ave
- 3606 Aberdeen Ave
- 3609 E Doerr Ave
- 3605 E Doerr Ave
- 3515 Ohio St
- 3613 E Doerr Ave
- 3620 Aberdeen Ave
- 3626 Aberdeen Ave
- 3513 Ohio St
- 1425 Doerr Ave
- 3628 Aberdeen Ave
- 3604 Aberdeen Ave
- 3625 E Doerr Ave
- 3630 Aberdeen Ave
- 3602 Aberdeen Ave
- 3511 Ohio St
- 3511 Ohio St
- 3617 E Doerr Ave
- 1423 Doerr Ave
- 3632 Aberdeen Ave
- 3600 Aberdeen Ave
Your Personal Tour Guide
Ask me questions while you tour the home.