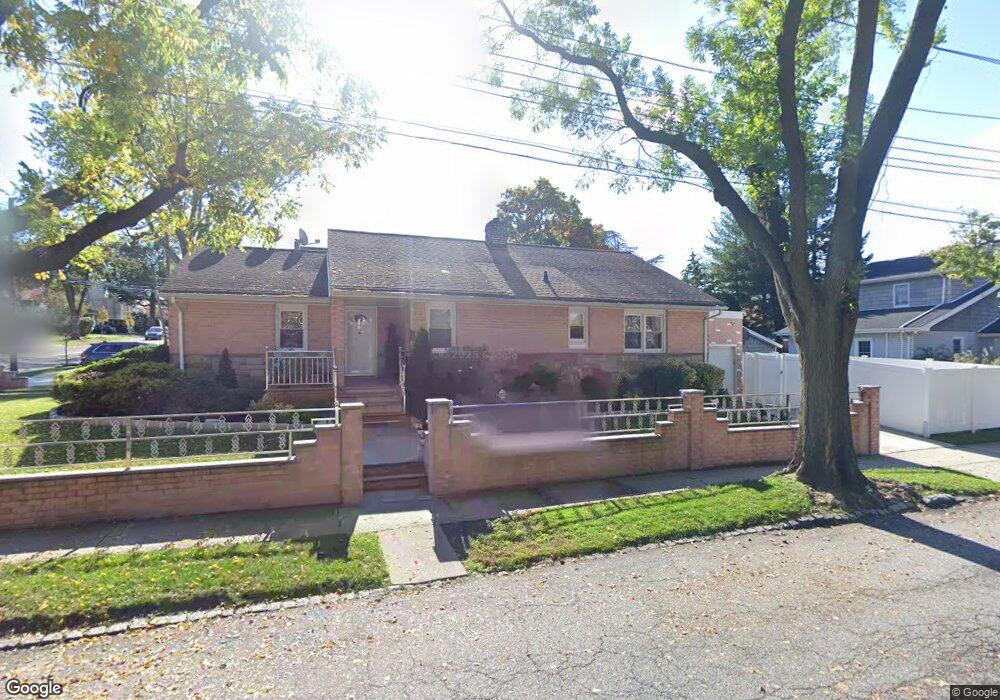
3602 Corporal Kennedy St Bayside, NY 11361
Bayside NeighborhoodEstimated Value: $1,155,484 - $1,395,000
--
Bed
--
Bath
1,490
Sq Ft
$854/Sq Ft
Est. Value
About This Home
This home is located at 3602 Corporal Kennedy St, Bayside, NY 11361 and is currently estimated at $1,272,121, approximately $853 per square foot. 3602 Corporal Kennedy St is a home located in Queens County with nearby schools including P.S. 159 Queens, M.S. 158 - Marie Curie, and Bayside High School.
Ownership History
Date
Name
Owned For
Owner Type
Purchase Details
Closed on
May 9, 2017
Sold by
David Fox
Bought by
Theotokas Ilias
Current Estimated Value
Home Financials for this Owner
Home Financials are based on the most recent Mortgage that was taken out on this home.
Original Mortgage
$100,000
Outstanding Balance
$82,979
Interest Rate
4.02%
Estimated Equity
$1,189,142
Purchase Details
Closed on
Jul 17, 2007
Sold by
Belesis Kaliopi and Belesis Kalle
Bought by
Theotokas Ilias
Purchase Details
Closed on
Jun 2, 1997
Sold by
Pavlica Frank L
Bought by
Tropaitis Peter and Belesis Kalle
Home Financials for this Owner
Home Financials are based on the most recent Mortgage that was taken out on this home.
Original Mortgage
$180,000
Interest Rate
7.87%
Create a Home Valuation Report for This Property
The Home Valuation Report is an in-depth analysis detailing your home's value as well as a comparison with similar homes in the area
Home Values in the Area
Average Home Value in this Area
Purchase History
| Date | Buyer | Sale Price | Title Company |
|---|---|---|---|
| Theotokas Ilias | -- | -- | |
| Theotokas Ilias | $810,000 | -- | |
| Tropaitis Peter | $280,000 | First American Title Ins Co |
Source: Public Records
Mortgage History
| Date | Status | Borrower | Loan Amount |
|---|---|---|---|
| Open | Theotokas Ilias | $100,000 | |
| Closed | Theotokas Ilias | -- | |
| Previous Owner | Tropaitis Peter | $180,000 |
Source: Public Records
Tax History Compared to Growth
Tax History
| Year | Tax Paid | Tax Assessment Tax Assessment Total Assessment is a certain percentage of the fair market value that is determined by local assessors to be the total taxable value of land and additions on the property. | Land | Improvement |
|---|---|---|---|---|
| 2025 | $4,597 | $56,584 | $12,050 | $44,534 |
| 2024 | $4,702 | $53,381 | $11,693 | $41,688 |
| 2023 | $9,352 | $50,362 | $9,917 | $40,445 |
| 2022 | $9,395 | $73,620 | $13,800 | $59,820 |
| 2021 | $9,859 | $62,700 | $13,800 | $48,900 |
| 2020 | $9,322 | $56,580 | $13,800 | $42,780 |
| 2019 | $8,647 | $62,340 | $13,800 | $48,540 |
| 2018 | $7,896 | $41,968 | $11,700 | $30,268 |
| 2017 | $7,909 | $41,968 | $11,159 | $30,809 |
| 2016 | $4,375 | $41,968 | $11,159 | $30,809 |
| 2015 | $2,426 | $39,294 | $12,160 | $27,134 |
| 2014 | $2,426 | $37,070 | $13,465 | $23,605 |
Source: Public Records
Map
Nearby Homes
- 20815 38th Ave
- 36-30 212th St
- 34-9 Corporal Kennedy St
- 3405 Corporal Kennedy St
- 207-15 39th Ave
- 35- 14 Clearview Expy Unit 354
- 3510 206th St Unit 350
- 211-22 34th Rd
- 35-29 205th St Unit 304
- 35-31 205th St Unit 300
- 35-31 205th St Unit 302
- 33-50 210th St
- 35-03 205th St Unit 329
- 35-42 205th St Unit 288
- 38-24 213th St
- 21135 34th Rd
- 36-46 205th St
- 209-10 41st Ave Unit 2J
- 35-12 205th St Unit 259
- 3611 204th St
- 36-06 Corporal Kennedy St
- 3606 Corporal Kennedy St
- 3612 Corporal Kennedy St
- 3603 209th St
- 36-03 209th St
- 3542 Corporal Kennedy St
- 3609 209th St
- 3616 Corporal Kennedy St
- 20903 36th Ave
- 3615 209th St
- 3603 Corporal Kennedy St
- 3607 Corporal Kennedy St
- 3536 Corporal Kennedy St
- 3611 Corporal Kennedy St
- 3620 Corporal Kennedy St
- 20929 36th Ave
- 209-29 36th Ave
- 3615 Corporal Kennedy St
- 3619 209th St
- 3535 209th St