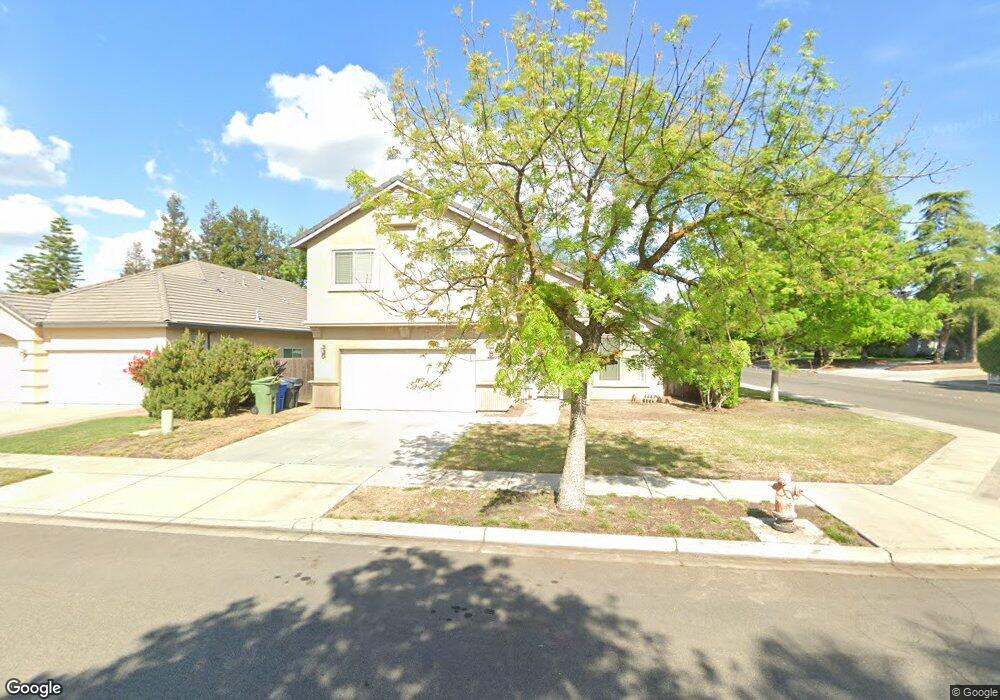
3602 Heirloom Ct Turlock, CA 95382
Estimated Value: $565,355 - $612,000
4
Beds
3
Baths
2,345
Sq Ft
$252/Sq Ft
Est. Value
About This Home
This home is located at 3602 Heirloom Ct, Turlock, CA 95382 and is currently estimated at $590,089, approximately $251 per square foot. 3602 Heirloom Ct is a home located in Stanislaus County with nearby schools including Sandra Tovar Medeiros Elementary School, Turlock Junior High School, and Marvin A. Dutcher Middle School.
Ownership History
Date
Name
Owned For
Owner Type
Purchase Details
Closed on
Aug 19, 2005
Sold by
Santos Jose Paulo
Bought by
Santos Sarah Ann
Current Estimated Value
Home Financials for this Owner
Home Financials are based on the most recent Mortgage that was taken out on this home.
Original Mortgage
$333,500
Outstanding Balance
$174,629
Interest Rate
5.61%
Mortgage Type
New Conventional
Estimated Equity
$415,460
Purchase Details
Closed on
Nov 21, 2002
Sold by
California Heirlooms Inc
Bought by
Campbell Sarah
Home Financials for this Owner
Home Financials are based on the most recent Mortgage that was taken out on this home.
Original Mortgage
$215,600
Interest Rate
6.71%
Create a Home Valuation Report for This Property
The Home Valuation Report is an in-depth analysis detailing your home's value as well as a comparison with similar homes in the area
Purchase History
| Date | Buyer | Sale Price | Title Company |
|---|---|---|---|
| Santos Sarah Ann | -- | Chicago Title | |
| Santos Sarah Ann | -- | Chicago Title | |
| Campbell Sarah | $269,500 | Chicago Title | |
| California Heirlooms Inc | -- | Chicago Title |
Source: Public Records
Mortgage History
| Date | Status | Borrower | Loan Amount |
|---|---|---|---|
| Open | Santos Sarah Ann | $333,500 | |
| Closed | Campbell Sarah | $215,600 | |
| Closed | Campbell Sarah | $53,900 |
Source: Public Records
Tax History
| Year | Tax Paid | Tax Assessment Tax Assessment Total Assessment is a certain percentage of the fair market value that is determined by local assessors to be the total taxable value of land and additions on the property. | Land | Improvement |
|---|---|---|---|---|
| 2025 | $4,149 | $390,301 | $72,403 | $317,898 |
| 2024 | $4,141 | $382,649 | $70,984 | $311,665 |
| 2023 | $4,291 | $375,147 | $69,593 | $305,554 |
| 2022 | $4,235 | $367,792 | $68,229 | $299,563 |
| 2021 | $4,141 | $360,582 | $66,892 | $293,690 |
| 2020 | $4,107 | $356,886 | $66,207 | $290,679 |
| 2019 | $4,027 | $349,889 | $64,909 | $284,980 |
| 2018 | $4,022 | $343,030 | $63,637 | $279,393 |
| 2017 | $3,909 | $336,305 | $62,390 | $273,915 |
| 2016 | $3,660 | $329,712 | $61,167 | $268,545 |
| 2015 | $3,625 | $324,761 | $60,249 | $264,512 |
| 2014 | $3,379 | $299,500 | $60,000 | $239,500 |
Source: Public Records
Map
Nearby Homes
- 3383 Summerdale Ave
- 3293 Dewar Ln
- 2783 Explorer Way
- 2352 Hidden Springs Ct
- 3352 Spring Crest Dr
- 3350 Spring Garden Dr
- 2042 Spring Blossom Ln
- 4213 Montara Dr
- 3503 Telluride Ln
- 2315 Merriment Ct
- 2333 Old Rose Ln
- 1481 Bluethroat Dr
- 1444 Waterthrush Way
- 2661 Bird Rock Place
- 99 Golden State Hwy
- 2531 Craftsman St
- 1360 Shady Ln Unit 923
- 1360 Shady Ln Unit 1022
- 2841 Blue Oak Ct
- 2470 Sea Lion Way
- 3612 Heirloom Ct
- 3609 N Kilroy Rd
- 3619 N Kilroy Rd
- 3622 Heirloom Ct
- 2500 Roberts Rd
- 3629 N Kilroy Rd
- 2510 Roberts Rd
- 3601 Heirloom Ct
- 3611 Heirloom Ct
- 2520 Roberts Rd
- 3632 Heirloom Ct
- 3639 N Kilroy Rd
- 3621 Heirloom Ct
- 2530 Roberts Rd
- 3649 N Kilroy Rd
- 2406 Roberts Rd
- 3631 Heirloom Ct
- 2541 Roberts Rd
- 2483 Roberts Rd
- 3642 Heirloom Ct
Your Personal Tour Guide
Ask me questions while you tour the home.