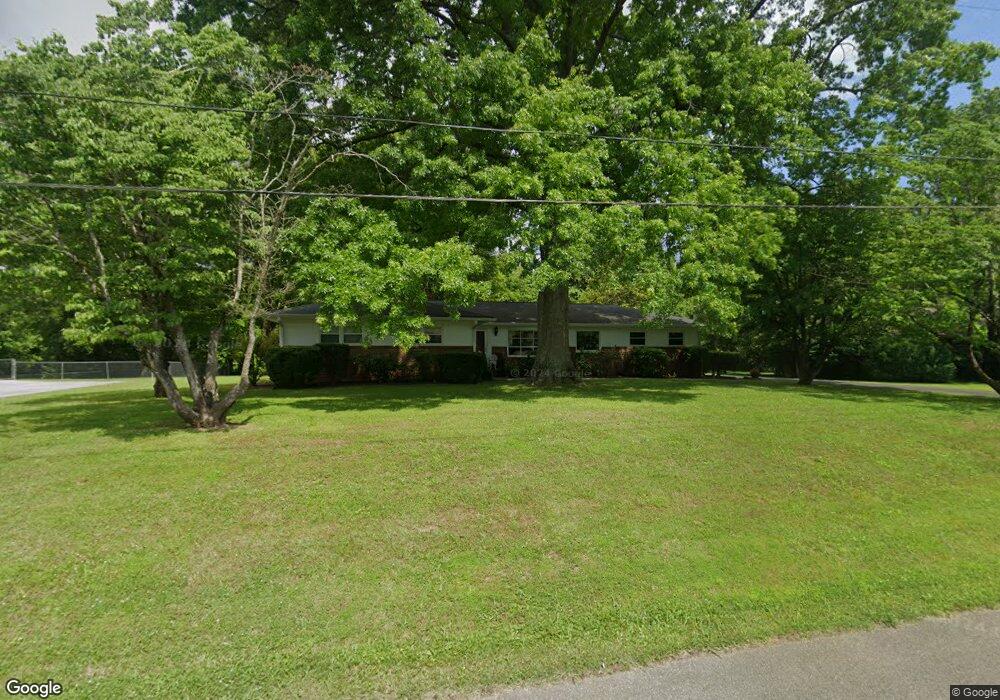
3603 Bowman Circle Dr NE Cleveland, TN 37312
Estimated Value: $276,755 - $345,000
--
Bed
2
Baths
1,655
Sq Ft
$191/Sq Ft
Est. Value
About This Home
This home is located at 3603 Bowman Circle Dr NE, Cleveland, TN 37312 and is currently estimated at $315,689, approximately $190 per square foot. 3603 Bowman Circle Dr NE is a home located in Bradley County with nearby schools including Mayfield Elementary School, Bowman Hills School, and Tennessee Christian Preparatory School.
Ownership History
Date
Name
Owned For
Owner Type
Purchase Details
Closed on
Jan 10, 2013
Sold by
Finnell Cynthia D
Bought by
Finnell Cynthia D Life Es and Finnell Frank R
Current Estimated Value
Purchase Details
Closed on
May 16, 1997
Sold by
Auberry Kenneth J
Bought by
Finnell Frank
Create a Home Valuation Report for This Property
The Home Valuation Report is an in-depth analysis detailing your home's value as well as a comparison with similar homes in the area
Home Values in the Area
Average Home Value in this Area
Purchase History
| Date | Buyer | Sale Price | Title Company |
|---|---|---|---|
| Finnell Cynthia D Life Es | -- | -- | |
| Finnell Cynthia D | -- | -- | |
| Finnell Frank | $129,900 | -- |
Source: Public Records
Tax History Compared to Growth
Tax History
| Year | Tax Paid | Tax Assessment Tax Assessment Total Assessment is a certain percentage of the fair market value that is determined by local assessors to be the total taxable value of land and additions on the property. | Land | Improvement |
|---|---|---|---|---|
| 2025 | $731 | $75,925 | $15,000 | $60,925 |
| 2024 | $731 | $50,800 | $11,675 | $39,125 |
| 2023 | $1,601 | $50,800 | $11,675 | $39,125 |
| 2022 | $1,601 | $50,800 | $11,675 | $39,125 |
| 2021 | $1,601 | $50,800 | $0 | $0 |
| 2020 | $1,433 | $50,800 | $0 | $0 |
| 2019 | $1,433 | $37,300 | $0 | $0 |
| 2018 | $1,536 | $0 | $0 | $0 |
| 2017 | $768 | $0 | $0 | $0 |
| 2016 | $1,283 | $0 | $0 | $0 |
| 2015 | $630 | $0 | $0 | $0 |
| 2014 | $629 | $0 | $0 | $0 |
Source: Public Records
Map
Nearby Homes
- 3609 Bowman Cir NE
- 313 Springhill Dr NE
- 3638 Bowman Circle Dr NE
- 9 Acorn Ln NE
- 3 Blythe Ferry Rd NE
- 5 Blythe Ferry Rd NE
- 201 Blythe Ferry Rd NE
- 3308 3309 Weeks Cir NE
- Lot 6 Parkside Place NE
- 3535 Edgewood Cir NW
- 3350 Steeple Cir NE
- 3 Weeks Dr NE
- 3358 Steeple Cir NE
- 3325 Steeple Cir NE
- 3362 Steeple Cir NE
- 3313 Steeple Cir NE
- 3330 Steeple Cir NE
- 3700 Moreland Dr NE
- 3301 Steeple Cir NE
- 3366 Steeple Cir NE
- 3605 Bowman Circle Dr NE
- 3601 Bowman Circle Dr NE
- 2211 Bowman Cir NE
- 3607 Bowman Circle Dr NE
- 3604 Bowman Circle Dr NE
- 3602 Bowman Circle Dr NE
- 3620 Ocoee St N
- 3606 Bowman Circle Dr NE
- 3626,3620 Ocoee St
- 3609 Bowman Circle Dr NE
- 3608 Bowman Circle Dr NE
- 315 Westview Dr NE
- 3610 Bowman Circle Dr NE
- 3611 Bowman Circle Dr NE
- 3626 Ocoee St N
- 385 Westview Dr NE
- 3731 Bowman Hills Cir
- Ocoee St
- Lot 10 Ocoee St N
- 3612 Bowman Circle Dr NE