
Landlord's Agent in 2020
Min Choe
Landmark Realty Associates
(856) 313-2712
4 in this area
20 Total Sales

Estimated Value: $313,123 - $344,000
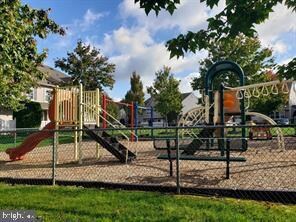
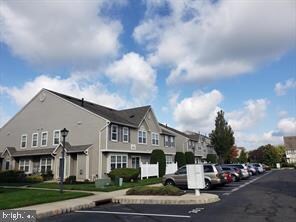
Good neighborhood. Excellent school system. Two beds &two and half baths. Bright and clean condition. Very convenient for accessing to main route 295& 38 and shopping areas. Ready to move. Please wear mask and gloves.
Last Agent to Rent the Property
(856) 313-2712 minchoe812@gmail.com Landmark Realty Associates Listed on: 10/11/2020
| Date | Buyer | Sale Price | Title Company |
|---|---|---|---|
| Choi Andrew I | $175,000 | Surety Title Co | |
| Lerner David | $128,720 | Settlers Title Agency Lp | |
| -- | $128,700 | -- |
| Date | Status | Borrower | Loan Amount |
|---|---|---|---|
| Previous Owner | -- | $124,160 |
| Date | Event | Price | List to Sale | Price per Sq Ft | Prior Sale |
|---|---|---|---|---|---|
| 12/01/2020 12/01/20 | Rented | $1,750 | 0.0% | -- | |
| 10/11/2020 10/11/20 | For Rent | $1,750 | +2.9% | -- | |
| 12/01/2019 12/01/19 | Rented | $1,700 | 0.0% | -- | |
| 10/13/2019 10/13/19 | For Rent | $1,700 | +3.0% | -- | |
| 04/01/2018 04/01/18 | Rented | $1,650 | 0.0% | -- | |
| 03/14/2018 03/14/18 | Under Contract | -- | -- | -- | |
| 03/07/2018 03/07/18 | For Rent | $1,650 | 0.0% | -- | |
| 03/06/2018 03/06/18 | Sold | $175,000 | -2.7% | $130 / Sq Ft | View Prior Sale |
| 02/02/2018 02/02/18 | Pending | -- | -- | -- | |
| 12/23/2017 12/23/17 | For Sale | $179,900 | 0.0% | $133 / Sq Ft | |
| 12/23/2017 12/23/17 | Pending | -- | -- | -- | |
| 11/16/2017 11/16/17 | Price Changed | $179,900 | -2.8% | $133 / Sq Ft | |
| 10/27/2017 10/27/17 | For Sale | $185,000 | -- | $137 / Sq Ft |
| Year | Tax Paid | Tax Assessment Tax Assessment Total Assessment is a certain percentage of the fair market value that is determined by local assessors to be the total taxable value of land and additions on the property. | Land | Improvement |
|---|---|---|---|---|
| 2025 | $5,219 | $165,300 | $45,000 | $120,300 |
| 2024 | $5,022 | $165,300 | $45,000 | $120,300 |
| 2023 | $5,022 | $165,300 | $45,000 | $120,300 |
| 2022 | $5,005 | $165,300 | $45,000 | $120,300 |
| 2021 | $4,911 | $165,300 | $45,000 | $120,300 |
| 2020 | $4,815 | $165,300 | $45,000 | $120,300 |
| 2019 | $4,766 | $165,300 | $45,000 | $120,300 |
| 2018 | $4,729 | $165,300 | $45,000 | $120,300 |
| 2017 | $4,607 | $165,300 | $45,000 | $120,300 |
| 2016 | $4,537 | $165,300 | $45,000 | $120,300 |
| 2015 | $4,485 | $165,300 | $45,000 | $120,300 |
| 2014 | $4,440 | $165,300 | $45,000 | $120,300 |
Landlord's Agent in 2020
Min Choe
Landmark Realty Associates
(856) 313-2712
4 in this area
20 Total Sales
T
Tenant's Agent in 2020
Teresa Williams
EXP Realty, LLC
Seller's Agent in 2018
John Wuertz
BHHS Fox & Roach
(856) 912-3219
35 in this area
336 Total Sales
Buyer's Agent in 2018
Robin Schoonmaker
RE/MAX
(856) 912-2000
6 in this area
59 Total Sales
Source: Bright MLS
MLS Number: NJBL383866
APN: 24-00301-21-00034-02-C3603
Disclaimer: Certain information contained herein is derived from information provided by parties other than Homes.com. All information provided is deemed reliable, but is not guaranteed to be accurate and should be independently verified.
![]() The data relating to real estate for sale on this website appears in part through the BRIGHT Internet Data Exchange program, a voluntary cooperative exchange of property listing data between licensed real estate brokerage firms, and is provided by BRIGHT through a licensing agreement.
The data relating to real estate for sale on this website appears in part through the BRIGHT Internet Data Exchange program, a voluntary cooperative exchange of property listing data between licensed real estate brokerage firms, and is provided by BRIGHT through a licensing agreement.
Listing information is from various brokers who participate in the Bright MLS IDX program and not all listings may be visible on the site.
The property information being provided on or through the website is for the personal, non-commercial use of consumers and such information may not be used for any purpose other than to identify prospective properties consumers may be interested in purchasing.
Some properties which appear for sale on the website may no longer be available because they are for instance, under contract, sold or are no longer being offered for sale.
Property information displayed is deemed reliable but is not guaranteed.
Copyright 2025 Bright MLS, Inc.