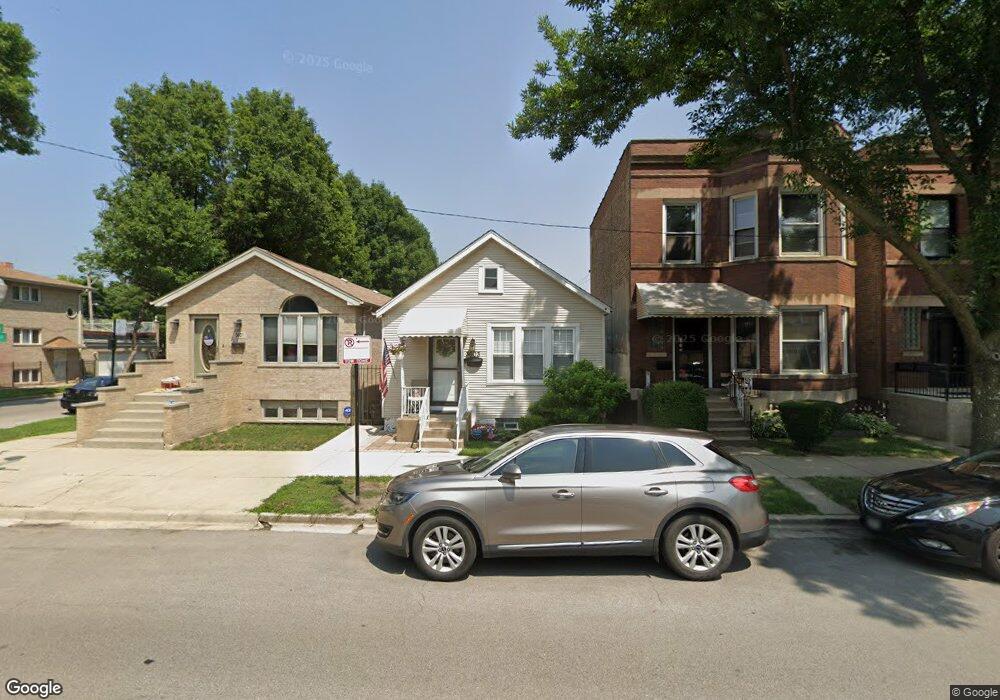
3603 S Lowe Ave Chicago, IL 60609
Bridgeport NeighborhoodEstimated Value: $307,000 - $443,000
2
Beds
1
Bath
1,071
Sq Ft
$357/Sq Ft
Est. Value
About This Home
This home is located at 3603 S Lowe Ave, Chicago, IL 60609 and is currently estimated at $382,676, approximately $357 per square foot. 3603 S Lowe Ave is a home located in Cook County with nearby schools including McClellan Elementary School, Namaste Elementary Charter School, and Perspectives/IIT Math & Science Academy.
Ownership History
Date
Name
Owned For
Owner Type
Purchase Details
Closed on
Jul 14, 2016
Sold by
Andrews David P
Bought by
Mangan George and Mangan Anne Fiedler
Current Estimated Value
Home Financials for this Owner
Home Financials are based on the most recent Mortgage that was taken out on this home.
Original Mortgage
$179,000
Outstanding Balance
$133,446
Interest Rate
4.25%
Mortgage Type
New Conventional
Estimated Equity
$249,231
Purchase Details
Closed on
Mar 10, 1999
Sold by
Chicago Title Land Trust Company
Bought by
Andrews David P
Home Financials for this Owner
Home Financials are based on the most recent Mortgage that was taken out on this home.
Original Mortgage
$60,000
Interest Rate
7.15%
Purchase Details
Closed on
Oct 13, 1997
Sold by
Annerino Theresa F
Bought by
The Chicago Trust Company and Trust #1104933
Create a Home Valuation Report for This Property
The Home Valuation Report is an in-depth analysis detailing your home's value as well as a comparison with similar homes in the area
Home Values in the Area
Average Home Value in this Area
Purchase History
| Date | Buyer | Sale Price | Title Company |
|---|---|---|---|
| Mangan George | $199,000 | Attorneys Title Guaranty Fun | |
| Andrews David P | $90,000 | Professional National Title | |
| The Chicago Trust Company | -- | -- |
Source: Public Records
Mortgage History
| Date | Status | Borrower | Loan Amount |
|---|---|---|---|
| Open | Mangan George | $179,000 | |
| Previous Owner | Andrews David P | $60,000 |
Source: Public Records
Tax History Compared to Growth
Tax History
| Year | Tax Paid | Tax Assessment Tax Assessment Total Assessment is a certain percentage of the fair market value that is determined by local assessors to be the total taxable value of land and additions on the property. | Land | Improvement |
|---|---|---|---|---|
| 2024 | $5,419 | $31,000 | $15,999 | $15,001 |
| 2023 | $5,965 | $29,000 | $13,094 | $15,906 |
| 2022 | $5,965 | $29,000 | $13,094 | $15,906 |
| 2021 | $5,831 | $28,999 | $13,094 | $15,905 |
| 2020 | $5,419 | $24,326 | $13,094 | $11,232 |
| 2019 | $5,492 | $27,333 | $13,094 | $14,239 |
| 2018 | $5,399 | $27,333 | $13,094 | $14,239 |
| 2017 | $4,837 | $22,471 | $10,416 | $12,055 |
| 2016 | $4,501 | $22,471 | $10,416 | $12,055 |
| 2015 | $4,118 | $22,471 | $10,416 | $12,055 |
| 2014 | $3,986 | $21,484 | $8,928 | $12,556 |
| 2013 | $3,907 | $21,484 | $8,928 | $12,556 |
Source: Public Records
Map
Nearby Homes
- 3549 S Lowe Ave
- 3600 S Union Ave
- 3640 S Lowe Ave
- 3624 S Parnell Ave
- 3505 S Parnell Ave Unit D
- 3416 S Union Ave
- 3727 S Lowe Ave
- 3405 S Union Ave
- 3700 S Normal Ave
- 3600 S Halsted St
- 3450 S Halsted St Unit 406
- 3450 S Halsted St Unit 416
- 3357 S Emerald Ave
- 835 W 35th St
- 3812 S Wallace St
- 3315 S Lowe Ave
- 3322 S Parnell Ave
- 455 W 38th St
- 3824 S Normal Ave
- 3830 S Emerald Ave
- 3601 S Lowe Ave
- 3607 S Lowe Ave
- 3609 S Lowe Ave Unit 1
- 3609 S Lowe Ave Unit 2
- 3611 S Lowe Ave
- 3613 S Lowe Ave
- 3617 S Lowe Ave
- 3559 S Lowe Ave
- 3559 S Lowe Ave
- 3557 S Lowe Ave
- 3619 S Lowe Ave
- 3602 S Wallace St
- 3604 S Wallace St
- 3600 S Wallace St
- 3608 S Wallace St
- 3555 S Lowe Ave
- 3610 S Wallace St
- 3621 S Lowe Ave
- 3610 S Lowe Ave