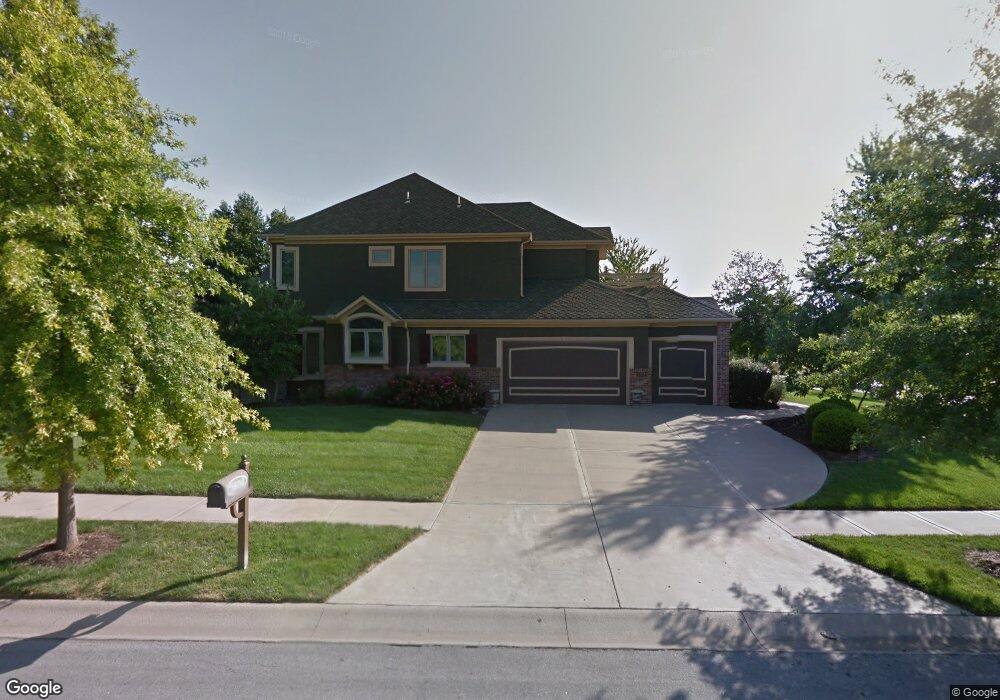
3604 W 141st St Overland Park, KS 66224
Estimated Value: $874,110 - $1,033,000
4
Beds
4
Baths
4,178
Sq Ft
$222/Sq Ft
Est. Value
About This Home
This home is located at 3604 W 141st St, Overland Park, KS 66224 and is currently estimated at $926,278, approximately $221 per square foot. 3604 W 141st St is a home located in Johnson County with nearby schools including Prairie Star Elementary School, Prairie Star Middle School, and Blue Valley High School.
Ownership History
Date
Name
Owned For
Owner Type
Purchase Details
Closed on
Dec 30, 2020
Sold by
Cunningham Kevin F and Cook Cunningham Sheri
Bought by
Cook Cunningham Sheri L and Cook Sheri L
Current Estimated Value
Purchase Details
Closed on
Mar 23, 2007
Sold by
Keleher Michael J
Bought by
Cunningham Kevin F and Cook Cunningham Sheri L
Home Financials for this Owner
Home Financials are based on the most recent Mortgage that was taken out on this home.
Original Mortgage
$300,000
Interest Rate
6.26%
Mortgage Type
New Conventional
Purchase Details
Closed on
Jul 30, 2002
Sold by
Mission Prairie Llc
Bought by
James Street Builders Llc
Home Financials for this Owner
Home Financials are based on the most recent Mortgage that was taken out on this home.
Original Mortgage
$443,200
Interest Rate
6.6%
Create a Home Valuation Report for This Property
The Home Valuation Report is an in-depth analysis detailing your home's value as well as a comparison with similar homes in the area
Home Values in the Area
Average Home Value in this Area
Purchase History
| Date | Buyer | Sale Price | Title Company |
|---|---|---|---|
| Cook Cunningham Sheri L | -- | None Available | |
| Sheri L Cook-Cunningham Amended And Restated | -- | None Listed On Document | |
| Cunningham Kevin F | -- | First American Title Ins Co | |
| James Street Builders Llc | -- | Security Land Title Company |
Source: Public Records
Mortgage History
| Date | Status | Borrower | Loan Amount |
|---|---|---|---|
| Previous Owner | Cunningham Kevin F | $300,000 | |
| Previous Owner | James Street Builders Llc | $443,200 | |
| Closed | James Street Builders Llc | $58,500 |
Source: Public Records
Tax History Compared to Growth
Tax History
| Year | Tax Paid | Tax Assessment Tax Assessment Total Assessment is a certain percentage of the fair market value that is determined by local assessors to be the total taxable value of land and additions on the property. | Land | Improvement |
|---|---|---|---|---|
| 2024 | $9,900 | $88,573 | $17,925 | $70,648 |
| 2023 | $9,348 | $82,696 | $17,925 | $64,771 |
| 2022 | $9,331 | $80,776 | $17,925 | $62,851 |
| 2021 | $9,054 | $74,934 | $17,925 | $57,009 |
| 2020 | $8,886 | $72,070 | $17,925 | $54,145 |
| 2019 | $9,082 | $72,335 | $17,925 | $54,410 |
| 2018 | $8,837 | $69,126 | $16,286 | $52,840 |
| 2017 | $9,741 | $74,888 | $14,803 | $60,085 |
| 2016 | $8,852 | $68,160 | $12,952 | $55,208 |
| 2015 | $8,514 | $64,768 | $11,778 | $52,990 |
| 2013 | -- | $63,894 | $10,705 | $53,189 |
Source: Public Records
Map
Nearby Homes
- 3849 W 139th Terrace
- 3905 W 142nd Dr
- 14200 Windsor St
- 3556 W 143rd Terrace
- 13804 Alhambra St
- 3903 W 158th Terrace
- 13810 Howe Ln
- 13806 Howe Ln
- 13802 Howe Ln
- 13801 Howe Ln
- 3811 W 138th St
- 0 Mission Rd Unit HMS2528409
- 4520 W 140th St
- 4512 W 139th St
- 14420 Mission Rd
- 14549 Windsor Dr
- 3116 W 137th St
- 4419 W 137th St
- 14617 Windsor Dr
- 13717 Springfield Rd
- 3608 W 141st St
- 14012 Pawnee Ln
- 14100 Mohawk Rd
- 14008 Pawnee Ln
- 3601 W 141st St
- 3703 W 141st St
- 3612 W 141st St
- 14104 Mohawk Rd
- 14004 Pawnee Ln
- 14107 Mohawk Rd
- 3707 W 141st St
- 14011 Pawnee Ln
- 14108 Mohawk Rd
- 14104 Pawnee Ln
- 3700 W 141st St
- 14007 Pawnee Ln
- 3704 W 141st St
- 14103 Pawnee Ln
- 3711 W 141st St
- 14111 Mohawk Rd