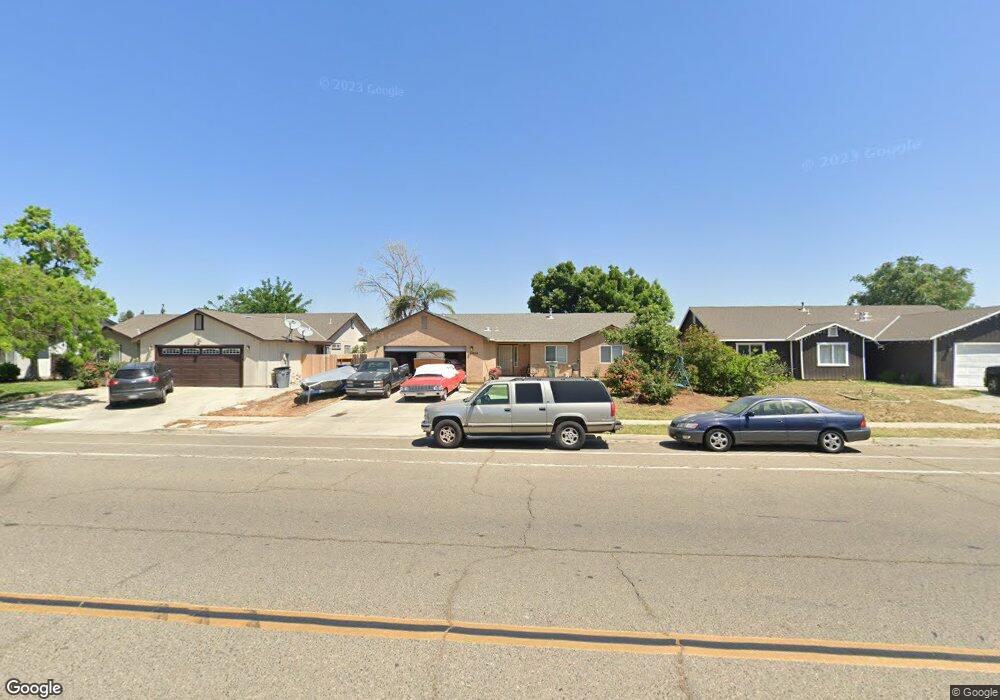
3604 W Dakota Ave Fresno, CA 93722
West Fresno NeighborhoodEstimated Value: $352,636 - $377,000
3
Beds
2
Baths
1,517
Sq Ft
$242/Sq Ft
Est. Value
About This Home
This home is located at 3604 W Dakota Ave, Fresno, CA 93722 and is currently estimated at $366,409, approximately $241 per square foot. 3604 W Dakota Ave is a home located in Fresno County with nearby schools including Roosevelt Elementary School, Glacier Point Middle School, and Aspen Valley Prep Academy.
Ownership History
Date
Name
Owned For
Owner Type
Purchase Details
Closed on
Dec 20, 2023
Sold by
Dhillon Harjinder Singh and Kau Karanjit
Bought by
Dhillon Karanjit Kaur
Current Estimated Value
Purchase Details
Closed on
Jul 17, 2014
Sold by
Dhillon Harjinder Singh and Dhillon Karanjit Kaur
Bought by
Dhillon Harjinder Singh and Kaur Karanjit
Purchase Details
Closed on
May 4, 2012
Sold by
Carlos Marc and Carlos Cynthia
Bought by
Dhillon Harjinder and Dhillon Karanjit
Home Financials for this Owner
Home Financials are based on the most recent Mortgage that was taken out on this home.
Original Mortgage
$78,750
Interest Rate
3.86%
Mortgage Type
New Conventional
Purchase Details
Closed on
Apr 11, 2002
Sold by
Cold Springs Rancheria Of Mono Indians
Bought by
Carlos Marc and Carlos Cynthia
Home Financials for this Owner
Home Financials are based on the most recent Mortgage that was taken out on this home.
Original Mortgage
$99,000
Interest Rate
7.08%
Create a Home Valuation Report for This Property
The Home Valuation Report is an in-depth analysis detailing your home's value as well as a comparison with similar homes in the area
Home Values in the Area
Average Home Value in this Area
Purchase History
| Date | Buyer | Sale Price | Title Company |
|---|---|---|---|
| Dhillon Karanjit Kaur | -- | None Listed On Document | |
| Dhillon Harjinder Singh | -- | None Available | |
| Dhillon Harjinder | $105,000 | Stewart Title Of California | |
| Carlos Marc | $110,000 | Chicago Title Co |
Source: Public Records
Mortgage History
| Date | Status | Borrower | Loan Amount |
|---|---|---|---|
| Previous Owner | Dhillon Harjinder | $78,750 | |
| Previous Owner | Carlos Marc | $99,000 |
Source: Public Records
Tax History Compared to Growth
Tax History
| Year | Tax Paid | Tax Assessment Tax Assessment Total Assessment is a certain percentage of the fair market value that is determined by local assessors to be the total taxable value of land and additions on the property. | Land | Improvement |
|---|---|---|---|---|
| 2025 | $1,675 | $131,871 | $39,558 | $92,313 |
| 2023 | $1,635 | $126,752 | $38,023 | $88,729 |
| 2022 | $1,543 | $124,268 | $37,278 | $86,990 |
| 2021 | $1,555 | $121,833 | $36,548 | $85,285 |
| 2020 | $1,479 | $120,585 | $36,174 | $84,411 |
| 2019 | $1,456 | $118,221 | $35,465 | $82,756 |
| 2018 | $1,423 | $115,904 | $34,770 | $81,134 |
| 2017 | $1,428 | $113,633 | $34,089 | $79,544 |
| 2016 | $1,317 | $111,406 | $33,421 | $77,985 |
| 2015 | $1,311 | $109,733 | $32,919 | $76,814 |
| 2014 | $1,310 | $107,585 | $32,275 | $75,310 |
Source: Public Records
Map
Nearby Homes
- 3612 W Garland Ave
- 3537 W Fedora Ave
- 3472 W Cortland Ave Unit 97
- 4205 W Saginaw Way
- 3546 N Berlin Ave
- 4200 W Dakota Ave
- 4206 W Dakota Ave
- 3342 W Shields Ave
- 3374 W Shields Ave Unit 101-4
- 2789 N Selland Ave
- 3425 W Forrest Dr
- 3138 W Dakota Ave Unit 210
- 3138 W Dakota Ave
- 4341 W Dakota Ave
- 2691 N Brawley Ave
- 3131 W Swift Ave
- 2645 W Robinson Ave
- 3546 W Harvard Ave
- 3656 W Harvard Ave
- 3317 W Indianapolis Ave
- 3592 W Dakota Ave
- 3582 W Dakota Ave
- 3624 W Dakota Ave
- 3398 N Marty Ave
- 3634 W Dakota Ave
- 3572 W Dakota Ave
- 3615 W Dakota Ave
- 3388 N Marty Ave
- 3562 W Dakota Ave
- 3644 W Dakota Ave
- 3387 N Dewey Ave
- 3625 W Dakota Ave
- 3396 N Dewey Ave
- 3378 N Marty Ave
- 3379 N Dewey Ave
- 3635 W Dakota Ave
- 3654 W Dakota Ave
- 3552 W Dakota Ave
- 3614 W Robinson Ave
- 3388 N Dewey Ave