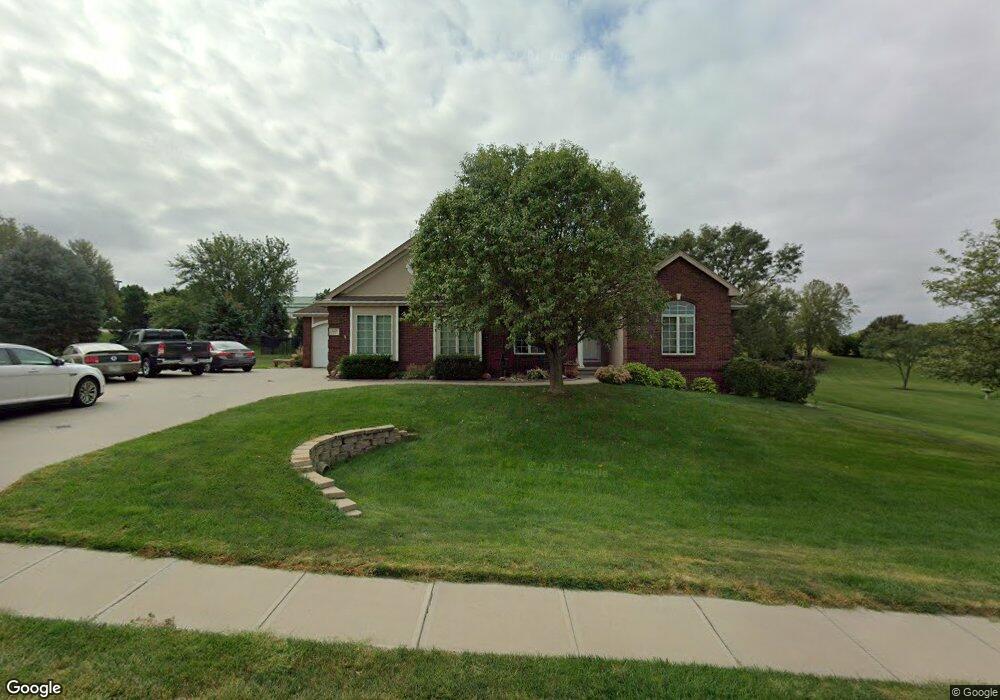
3605 Fox Ridge Dr Bellevue, NE 68123
Estimated Value: $374,000 - $623,927
3
Beds
2
Baths
1,777
Sq Ft
$282/Sq Ft
Est. Value
About This Home
This home is located at 3605 Fox Ridge Dr, Bellevue, NE 68123 and is currently estimated at $501,482, approximately $282 per square foot. 3605 Fox Ridge Dr is a home located in Sarpy County with nearby schools including Bellevue Elementary School, Lewis & Clark Middle School, and Bellevue West High School.
Ownership History
Date
Name
Owned For
Owner Type
Purchase Details
Closed on
Nov 5, 2003
Sold by
Belt Construction Inc
Bought by
Minarik Brian P and Minarik Rina
Current Estimated Value
Home Financials for this Owner
Home Financials are based on the most recent Mortgage that was taken out on this home.
Original Mortgage
$187,300
Outstanding Balance
$86,410
Interest Rate
5.93%
Estimated Equity
$415,072
Purchase Details
Closed on
Jun 20, 2003
Sold by
Mlnarik Brian and Mlnarik Rina
Bought by
Belt Construction Inc
Home Financials for this Owner
Home Financials are based on the most recent Mortgage that was taken out on this home.
Original Mortgage
$150,000
Interest Rate
5.27%
Mortgage Type
Small Business Administration
Create a Home Valuation Report for This Property
The Home Valuation Report is an in-depth analysis detailing your home's value as well as a comparison with similar homes in the area
Home Values in the Area
Average Home Value in this Area
Purchase History
| Date | Buyer | Sale Price | Title Company |
|---|---|---|---|
| Minarik Brian P | $235,000 | -- | |
| Belt Construction Inc | $44,000 | -- |
Source: Public Records
Mortgage History
| Date | Status | Borrower | Loan Amount |
|---|---|---|---|
| Open | Minarik Brian P | $187,300 | |
| Previous Owner | Belt Construction Inc | $150,000 | |
| Closed | Minarik Brian P | $35,118 |
Source: Public Records
Tax History Compared to Growth
Tax History
| Year | Tax Paid | Tax Assessment Tax Assessment Total Assessment is a certain percentage of the fair market value that is determined by local assessors to be the total taxable value of land and additions on the property. | Land | Improvement |
|---|---|---|---|---|
| 2025 | $8,626 | $494,388 | $90,000 | $404,388 |
| 2024 | $9,221 | $491,929 | $85,000 | $406,929 |
| 2023 | $9,221 | $436,681 | $72,000 | $364,681 |
| 2022 | $7,965 | $370,134 | $63,000 | $307,134 |
| 2021 | $7,451 | $342,556 | $60,000 | $282,556 |
| 2020 | $7,368 | $337,667 | $58,000 | $279,667 |
| 2019 | $8,385 | $315,681 | $58,000 | $257,681 |
| 2018 | $7,959 | $304,278 | $53,000 | $251,278 |
| 2017 | $7,884 | $299,055 | $53,000 | $246,055 |
| 2016 | $6,535 | $252,049 | $53,000 | $199,049 |
| 2015 | $6,571 | $255,194 | $53,000 | $202,194 |
| 2014 | $6,598 | $256,032 | $53,000 | $203,032 |
| 2012 | -- | $249,372 | $53,000 | $196,372 |
Source: Public Records
Map
Nearby Homes
- 13602 S 36th St
- 3508 Jason Cir
- 14010 S 35th St
- 14013 S 35th St
- 3504 Sheridan Cir
- 3716 Lookingglass Dr
- 3309 Lookingglass Dr
- 13717 S 42nd Ave
- 3728 Schuemann Dr
- 13609 S 42nd Ave
- 13809 S 42nd Ave
- 3113 Tammy St
- 3738 Falcon Dr
- 3506 Lynnwood Dr
- 2923 Blackhawk Dr
- 4369 Lookingglass Dr
- 3209 Meghan Dr
- 3105 Mirror Cir
- 4409 Lookingglass Dr
- 3108 Mirror Cir
- 3603 Fox Ridge Dr
- 3701 Fox Ridge Dr
- 13704 S 37th Cir
- 3604 Fox Ridge Dr
- 3703 Fox Ridge Dr
- 3601 Fox Ridge Dr
- 3602 Fox Ridge Dr
- 13701 S 37th Cir
- 13702 S 37th Cir
- 13701 S 37th Cir
- 13801 S 36th St
- 13815 S 36th St
- 13711 S 36th St
- 3807 Fox Ridge Dr
- 13903 S 36th St
- 13703 S 36th St
- 13703 S 38th St
- 13705 S 38th St
- 3502 Birchwood Dr
- 13913 S 39th Cir