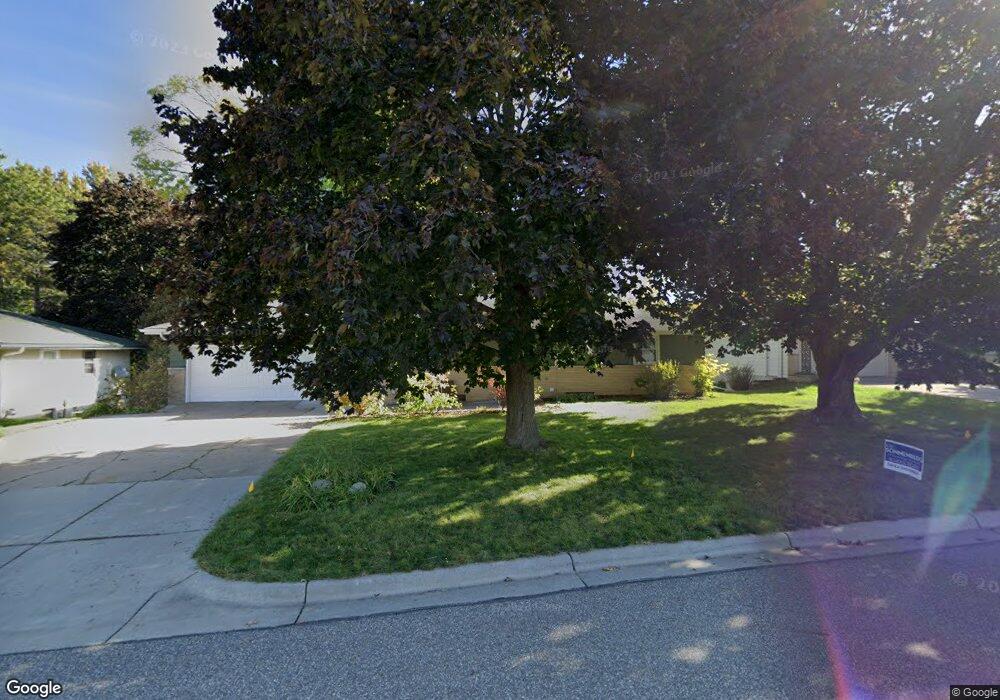
3605 Harding St NE Saint Anthony, MN 55418
Estimated Value: $416,000 - $493,000
4
Beds
2
Baths
1,248
Sq Ft
$363/Sq Ft
Est. Value
About This Home
This home is located at 3605 Harding St NE, Saint Anthony, MN 55418 and is currently estimated at $453,018, approximately $362 per square foot. 3605 Harding St NE is a home located in Hennepin County with nearby schools including Wilshire Park Elementary School, Highland Elementary School, and St. Anthony Middle School.
Ownership History
Date
Name
Owned For
Owner Type
Purchase Details
Closed on
May 6, 2022
Sold by
Schober and Emily
Bought by
Schober Daniel and Schober Emily
Current Estimated Value
Purchase Details
Closed on
Apr 20, 2018
Sold by
Fourth Properties Llc
Bought by
Schober Daniel and Vomastek Emily
Home Financials for this Owner
Home Financials are based on the most recent Mortgage that was taken out on this home.
Original Mortgage
$275,920
Interest Rate
4.46%
Mortgage Type
New Conventional
Purchase Details
Closed on
Mar 7, 2017
Sold by
Labissonierre Jeannermarie La
Bought by
Fourth Properties Llc
Home Financials for this Owner
Home Financials are based on the most recent Mortgage that was taken out on this home.
Original Mortgage
$227,200
Interest Rate
4.19%
Mortgage Type
Commercial
Purchase Details
Closed on
Mar 1, 2011
Sold by
Labissoniere William R
Bought by
Labissoniere Jeannemarie
Create a Home Valuation Report for This Property
The Home Valuation Report is an in-depth analysis detailing your home's value as well as a comparison with similar homes in the area
Home Values in the Area
Average Home Value in this Area
Purchase History
| Date | Buyer | Sale Price | Title Company |
|---|---|---|---|
| Schober Daniel | $500 | None Listed On Document | |
| Schober Daniel | $344,900 | Watermark Title Agency | |
| Fourth Properties Llc | $224,000 | Watermark Title Agency | |
| Labissoniere Jeannemarie | -- | -- |
Source: Public Records
Mortgage History
| Date | Status | Borrower | Loan Amount |
|---|---|---|---|
| Previous Owner | Schober Daniel | $275,920 | |
| Previous Owner | Fourth Properties Llc | $227,200 |
Source: Public Records
Tax History Compared to Growth
Tax History
| Year | Tax Paid | Tax Assessment Tax Assessment Total Assessment is a certain percentage of the fair market value that is determined by local assessors to be the total taxable value of land and additions on the property. | Land | Improvement |
|---|---|---|---|---|
| 2024 | $7,381 | $437,900 | $135,500 | $302,400 |
| 2023 | $7,297 | $444,900 | $157,500 | $287,400 |
| 2022 | $6,426 | $422,000 | $146,000 | $276,000 |
| 2021 | $5,963 | $387,000 | $148,000 | $239,000 |
| 2020 | $6,223 | $360,000 | $127,000 | $233,000 |
| 2019 | $5,849 | $357,000 | $122,000 | $235,000 |
| 2018 | $4,035 | $326,000 | $103,000 | $223,000 |
| 2017 | $4,607 | $225,000 | $85,000 | $140,000 |
| 2016 | $4,422 | $215,000 | $78,000 | $137,000 |
| 2015 | $3,927 | $182,000 | $67,000 | $115,000 |
| 2014 | -- | $183,000 | $82,000 | $101,000 |
Source: Public Records
Map
Nearby Homes
- 3621 Edward St NE
- 3637 Coolidge St NE
- 2517 36th Ave NE
- 2550 38th Ave NE Unit 112
- 2540 38th Ave NE Unit 217
- 3642 Stinson Blvd
- 2405 39th Ave NE Unit 307
- 3212 33rd Ave NE
- 3960 Mckinley St NE
- 3243 Mckinley St NE
- 3912 Cleveland St NE
- 3808 Foss Rd Unit 2
- 3511 Maplewood Dr
- 3971 Arthur St NE
- 2916 31st Ave NE
- 3434 Silver Ln NE
- 4034 Cleveland St NE
- 3232 Old Highway 8
- 3013 Silver Lake Rd NE
- 3915 Foss Rd Unit 102
- 3611 Harding St NE
- 3601 Harding St NE
- 3604 Coolidge St NE
- 3608 Coolidge St NE
- 3604 Coolidge St NE
- 3600 Coolidge St NE
- 3600 Coolidge St NE
- 3612 Coolidge St NE
- 3615 Harding St NE
- 3606 Harding St NE
- 3612 Coolidge St NE
- 3600 Harding St NE
- 3610 Harding St NE
- 3616 Coolidge St NE
- 3541 Harding St NE
- 3612 Harding St NE
- 3612 Harding St NE
- 3542 Coolidge St NE
- 3616 3616 Coolidge-Street-ne
- 3620 Coolidge St NE