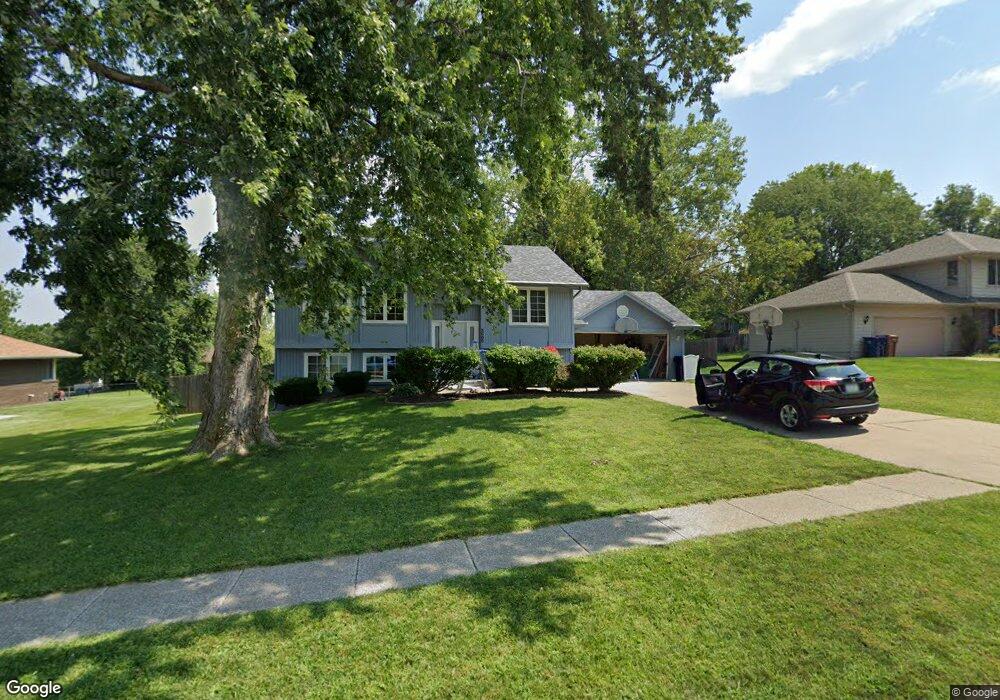
3605 Melanie Dr Urbandale, IA 50322
Estimated Value: $258,000 - $303,220
2
Beds
3
Baths
930
Sq Ft
$305/Sq Ft
Est. Value
About This Home
This home is located at 3605 Melanie Dr, Urbandale, IA 50322 and is currently estimated at $283,305, approximately $304 per square foot. 3605 Melanie Dr is a home located in Polk County with nearby schools including Valerius Elementary School, Urbandale Middle School, and Urbandale High School.
Ownership History
Date
Name
Owned For
Owner Type
Purchase Details
Closed on
Oct 28, 2009
Sold by
Secretary Of Veteran Affairs
Bought by
Kiobel Moses and Kiobel Leburabari
Current Estimated Value
Home Financials for this Owner
Home Financials are based on the most recent Mortgage that was taken out on this home.
Original Mortgage
$130,688
Interest Rate
4.87%
Mortgage Type
FHA
Purchase Details
Closed on
Jun 9, 2009
Sold by
Bac Home Loans Servicing Lp
Bought by
Secretary Of The Department Of Veterans
Purchase Details
Closed on
May 7, 2009
Sold by
Naylor William J and Naylor Bozica
Bought by
Bac Home Loans Servicing Lp
Purchase Details
Closed on
Jun 16, 2000
Sold by
Mona James A and Mona Lynne
Bought by
Naylor William J and Naylor Bozica
Home Financials for this Owner
Home Financials are based on the most recent Mortgage that was taken out on this home.
Original Mortgage
$136,578
Interest Rate
8.31%
Mortgage Type
VA
Create a Home Valuation Report for This Property
The Home Valuation Report is an in-depth analysis detailing your home's value as well as a comparison with similar homes in the area
Home Values in the Area
Average Home Value in this Area
Purchase History
| Date | Buyer | Sale Price | Title Company |
|---|---|---|---|
| Kiobel Moses | -- | None Available | |
| Secretary Of The Department Of Veterans | $144,500 | None Available | |
| Bac Home Loans Servicing Lp | $144,533 | None Available | |
| Naylor William J | $133,500 | -- |
Source: Public Records
Mortgage History
| Date | Status | Borrower | Loan Amount |
|---|---|---|---|
| Previous Owner | Kiobel Moses | $130,688 | |
| Previous Owner | Naylor William J | $136,578 |
Source: Public Records
Tax History Compared to Growth
Tax History
| Year | Tax Paid | Tax Assessment Tax Assessment Total Assessment is a certain percentage of the fair market value that is determined by local assessors to be the total taxable value of land and additions on the property. | Land | Improvement |
|---|---|---|---|---|
| 2025 | $4,468 | $275,800 | $78,500 | $197,300 |
| 2024 | $4,468 | $257,200 | $72,200 | $185,000 |
| 2023 | $4,330 | $257,200 | $72,200 | $185,000 |
| 2022 | $4,278 | $210,700 | $60,500 | $150,200 |
| 2021 | $4,250 | $210,700 | $60,500 | $150,200 |
| 2020 | $4,174 | $198,800 | $57,100 | $141,700 |
| 2019 | $3,740 | $198,800 | $57,100 | $141,700 |
| 2018 | $3,600 | $171,200 | $48,200 | $123,000 |
| 2017 | $3,270 | $171,200 | $48,200 | $123,000 |
| 2016 | $3,186 | $153,600 | $42,900 | $110,700 |
| 2015 | $3,186 | $153,600 | $42,900 | $110,700 |
| 2014 | $3,440 | $163,700 | $43,600 | $120,100 |
Source: Public Records
Map
Nearby Homes
- 3808 Mary Lynn Dr
- 3805 Melanie Cir
- Lot 1 Hillsdale Dr
- 3320 Patricia Dr
- 3889 92nd Dr
- 3913 Horton Trail
- 3916 Greenview Dr
- 3957 92nd Dr
- 4517 90th St
- 4505 90th St
- 4500 90th St
- 4001 Patricia Dr
- 37 89th St
- 4016 Patricia Dr
- 8 Quail Ridge
- 7 Quail Ridge
- 6 Quail Ridge
- 5 Quail Ridge
- 4 Quail Ridge
- 3 Quail Ridge
- 3601 Melanie Dr
- 9408 Monroe Ct
- 3608 Mary Lynn Dr
- 3604 Mary Lynn Dr
- 9501 Dennis Dr
- 3612 Mary Lynn Dr
- 3610 Melanie Dr
- 3505 Melanie Dr
- 3600 Mary Lynn Dr
- 9505 Dennis Dr
- 9504 Monroe Ct
- 9409 Monroe Ct
- 3504 Mary Lynn Dr
- 9413 Monroe Ct
- 3504 Melanie Dr
- 9405 Monroe Ct
- 3501 Melanie Dr
- 9417 Monroe Ct
- 9401 Monroe Ct
- 9501 Monroe Ct