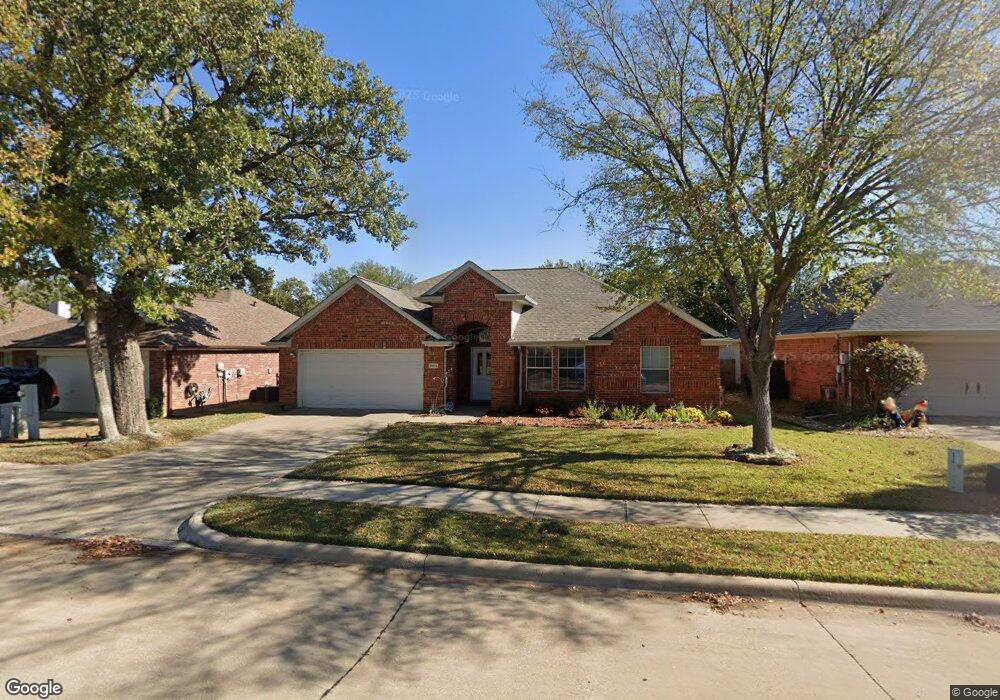
3605 Paint Dr Denton, TX 76210
South Denton NeighborhoodEstimated Value: $356,091 - $373,000
3
Beds
2
Baths
1,675
Sq Ft
$218/Sq Ft
Est. Value
About This Home
This home is located at 3605 Paint Dr, Denton, TX 76210 and is currently estimated at $364,523, approximately $217 per square foot. 3605 Paint Dr is a home located in Denton County with nearby schools including Houston Elementary School, McMath Middle School, and Denton High School.
Ownership History
Date
Name
Owned For
Owner Type
Purchase Details
Closed on
May 31, 2012
Sold by
Williams Anna Kyle and Williams Clint
Bought by
Holland Joseph J
Current Estimated Value
Home Financials for this Owner
Home Financials are based on the most recent Mortgage that was taken out on this home.
Original Mortgage
$151,692
Outstanding Balance
$105,620
Interest Rate
3.93%
Mortgage Type
VA
Estimated Equity
$258,903
Purchase Details
Closed on
Jul 18, 2007
Sold by
Kyle Gloria Keese
Bought by
Williams Anna Kyle and Williams Clint
Home Financials for this Owner
Home Financials are based on the most recent Mortgage that was taken out on this home.
Original Mortgage
$21,000
Interest Rate
6.73%
Mortgage Type
Stand Alone Second
Purchase Details
Closed on
Jul 14, 2006
Sold by
James Ronald L and James Phyllis M
Bought by
Kyle Gloria Keese
Purchase Details
Closed on
May 23, 2002
Sold by
Bowen Builders Group Of Texas Inc
Bought by
James Ronald L and James Phyllis M
Home Financials for this Owner
Home Financials are based on the most recent Mortgage that was taken out on this home.
Original Mortgage
$100,750
Interest Rate
6.77%
Create a Home Valuation Report for This Property
The Home Valuation Report is an in-depth analysis detailing your home's value as well as a comparison with similar homes in the area
Home Values in the Area
Average Home Value in this Area
Purchase History
| Date | Buyer | Sale Price | Title Company |
|---|---|---|---|
| Holland Joseph J | -- | None Available | |
| Williams Anna Kyle | -- | Title Resources | |
| Kyle Gloria Keese | -- | Rtt | |
| James Ronald L | -- | -- |
Source: Public Records
Mortgage History
| Date | Status | Borrower | Loan Amount |
|---|---|---|---|
| Open | Holland Joseph J | $151,692 | |
| Previous Owner | Williams Anna Kyle | $21,000 | |
| Previous Owner | Williams Anna Kyle | $112,000 | |
| Previous Owner | James Ronald L | $100,750 |
Source: Public Records
Tax History
| Year | Tax Paid | Tax Assessment Tax Assessment Total Assessment is a certain percentage of the fair market value that is determined by local assessors to be the total taxable value of land and additions on the property. | Land | Improvement |
|---|---|---|---|---|
| 2025 | $4,869 | $356,631 | $90,056 | $287,480 |
| 2024 | $6,258 | $324,210 | $0 | $0 |
| 2023 | $4,240 | $294,736 | $90,056 | $256,955 |
| 2022 | $5,688 | $267,942 | $90,056 | $231,663 |
| 2021 | $5,415 | $243,584 | $66,723 | $176,861 |
| 2020 | $5,095 | $222,900 | $66,723 | $156,177 |
| 2019 | $5,208 | $218,268 | $66,723 | $151,545 |
| 2018 | $5,067 | $209,755 | $66,723 | $148,896 |
| 2017 | $4,713 | $190,686 | $38,921 | $151,765 |
| 2016 | $4,189 | $178,281 | $38,921 | $140,785 |
| 2015 | $3,619 | $162,074 | $38,921 | $123,153 |
| 2014 | $3,619 | $155,245 | $38,921 | $116,324 |
| 2013 | -- | $142,670 | $38,921 | $103,749 |
Source: Public Records
Map
Nearby Homes
- 3448 Tuscan Hills Cir
- 3428 Tuscan Hills Cir
- 3509 Tuscan Hills Cir
- 3000 Bella Lago Dr
- 2721 Arabian Ave
- 2804 Hollow Ridge Dr
- 3017 Bella Lago Dr
- 2721 Clubhouse Dr
- 2700 Hereford Rd
- 2720 Hilcroft Ave
- 3717 Ranchman Blvd
- 2600 Pioneer Dr
- 3509 Mustang Dr
- 2508 Pioneer Dr
- 2517 Pioneer Dr
- 2700 Crater Lake Ln
- 2409 Loon Lake Rd
- 2508 Kariba Ln
- 2816 Memorial Dr
- 2209 Loon Lake Rd
- 3601 Paint Dr
- 3609 Paint Dr
- 3517 Paint Dr
- 3613 Paint Dr
- 2820 Arabian Ave
- 3452 Tuscan Hills Cir
- 2821 Hereford Rd
- 3513 Paint Dr
- 3456 Tuscan Hills Cir
- 3444 Tuscan Hills Cir
- 3617 Paint Dr
- 3460 Tuscan Hills Cir
- 3440 Tuscan Hills Cir
- 2816 Arabian Ave
- 3464 Tuscan Hills Cir
- 3509 Paint Dr
- 2821 Arabian Ave
- 3436 Tuscan Hills Cir
- 3621 Paint Dr
- 3468 Tuscan Hills Cir
Your Personal Tour Guide
Ask me questions while you tour the home.