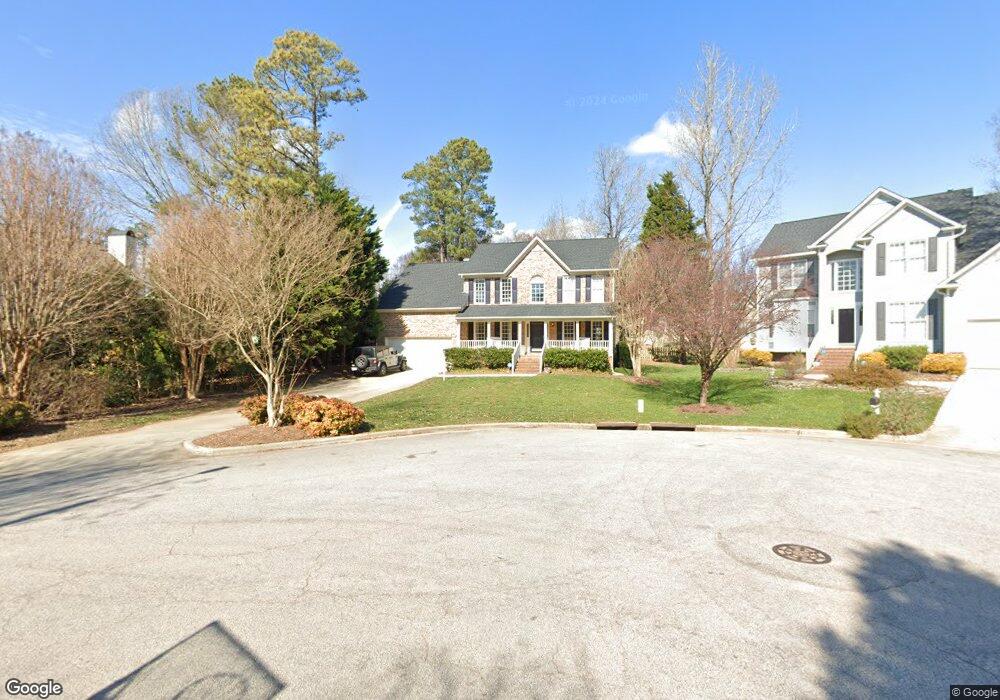
3605 Summer Leaf Ct Raleigh, NC 27615
Durant NeighborhoodEstimated Value: $585,720 - $667,000
5
Beds
3
Baths
2,698
Sq Ft
$235/Sq Ft
Est. Value
About This Home
This home is located at 3605 Summer Leaf Ct, Raleigh, NC 27615 and is currently estimated at $634,180, approximately $235 per square foot. 3605 Summer Leaf Ct is a home located in Wake County with nearby schools including Durant Road Elementary, Durant Road Middle, and Millbrook High School.
Ownership History
Date
Name
Owned For
Owner Type
Purchase Details
Closed on
Jul 20, 2015
Sold by
Gordon Michael R and Gordon Denelle L
Bought by
Keating Marylin
Current Estimated Value
Home Financials for this Owner
Home Financials are based on the most recent Mortgage that was taken out on this home.
Original Mortgage
$185,000
Outstanding Balance
$145,153
Interest Rate
4.04%
Mortgage Type
New Conventional
Estimated Equity
$489,027
Purchase Details
Closed on
Jan 31, 2006
Sold by
Fleming Tracy L and Fleming Katherine H
Bought by
Gordon Michael R and Gordon Denelle L
Home Financials for this Owner
Home Financials are based on the most recent Mortgage that was taken out on this home.
Original Mortgage
$300,200
Interest Rate
6.21%
Mortgage Type
Fannie Mae Freddie Mac
Purchase Details
Closed on
May 16, 2001
Sold by
Cooke Thomas E
Bought by
Fleming Tracy L and Fleming Katherine H
Home Financials for this Owner
Home Financials are based on the most recent Mortgage that was taken out on this home.
Original Mortgage
$247,500
Interest Rate
5.75%
Create a Home Valuation Report for This Property
The Home Valuation Report is an in-depth analysis detailing your home's value as well as a comparison with similar homes in the area
Home Values in the Area
Average Home Value in this Area
Purchase History
| Date | Buyer | Sale Price | Title Company |
|---|---|---|---|
| Keating Marylin | $333,500 | Attorney | |
| Gordon Michael R | $316,000 | None Available | |
| Fleming Tracy L | $275,000 | -- |
Source: Public Records
Mortgage History
| Date | Status | Borrower | Loan Amount |
|---|---|---|---|
| Open | Keating Marylin | $185,000 | |
| Previous Owner | Gordon Michael R | $300,200 | |
| Previous Owner | Fleming Tracy L | $247,500 |
Source: Public Records
Tax History
| Year | Tax Paid | Tax Assessment Tax Assessment Total Assessment is a certain percentage of the fair market value that is determined by local assessors to be the total taxable value of land and additions on the property. | Land | Improvement |
|---|---|---|---|---|
| 2025 | $5,098 | $582,314 | $175,000 | $407,314 |
| 2024 | $5,077 | $582,314 | $175,000 | $407,314 |
Source: Public Records
Map
Nearby Homes
- 9112 W Doublebit Dr
- 9209 Dakins Ct
- 9512 Anson Grove Ln
- 9332 Leslieshire Dr
- 8606 London Park Ct
- 9308 Leslieshire Dr
- 9212 Sayornis Ct
- 9220 Pennythorne Ct
- 1300 Durlain Dr Unit 105
- 3047 Coxindale Dr
- 2804 Shofield Ct
- 2501 Scouting Trail
- 10204 Rocky Ford Ct
- 2549 Quarry Rd
- 2505 Coxindale Dr
- 1440 Chelton Oaks Place
- 2224 Effingham Cir
- 10415 Ashmead Ln
- 8324 Bellingham Cir
- 10567 Pleasant Branch Dr Unit 201
- 3609 Summer Leaf Ct
- 9004 Deerland Grove Dr
- 9000 Deerland Grove Dr
- 3612 Spring Willow Place
- 3608 Spring Willow Place
- 9012 Deerland Grove Dr
- 3613 Summer Leaf Ct
- 3604 Spring Willow Place
- 3616 Spring Willow Place
- 3604 Summer Leaf Ct
- 3608 Summer Leaf Ct
- 8908 Deerland Grove Dr
- 9020 Deerland Grove Dr
- 9005 Deerland Grove Dr
- 9009 Deerland Grove Dr
- 3620 Spring Willow Place
- 9001 Deerland Grove Dr
- 9013 Deerland Grove Dr
- 8904 Deerland Grove Dr
- 8917 Deerland Grove Dr
Your Personal Tour Guide
Ask me questions while you tour the home.