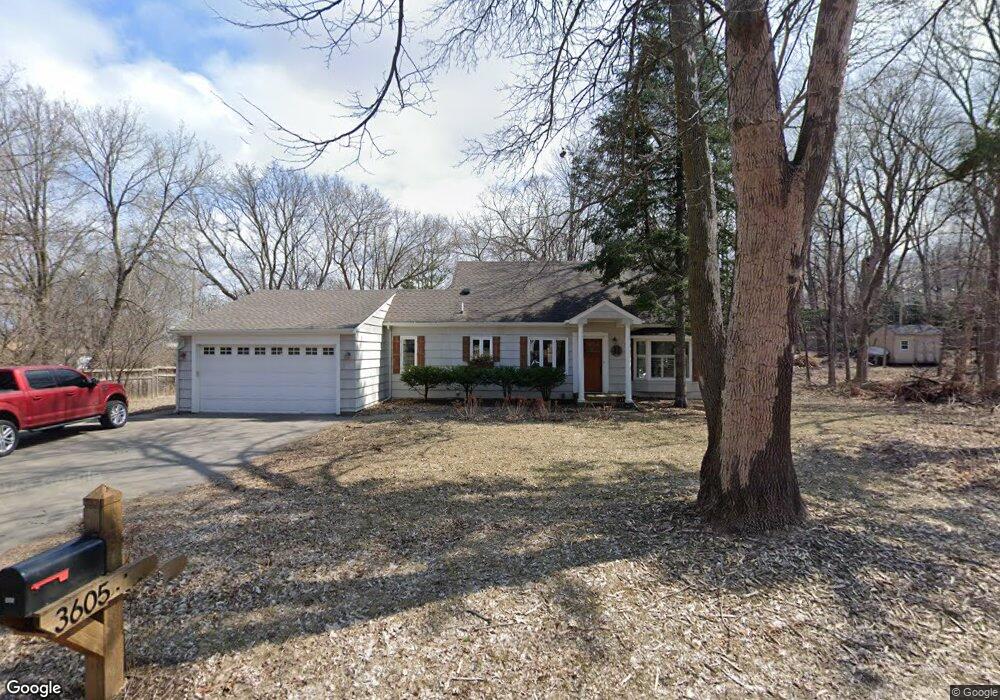
3605 Westview Dr Wayzata, MN 55391
Estimated Value: $556,000 - $688,000
3
Beds
3
Baths
1,523
Sq Ft
$421/Sq Ft
Est. Value
About This Home
This home is located at 3605 Westview Dr, Wayzata, MN 55391 and is currently estimated at $640,453, approximately $420 per square foot. 3605 Westview Dr is a home located in Hennepin County with nearby schools including Deephaven Elementary School, Minnetonka East Middle School, and Minnetonka Senior High School.
Ownership History
Date
Name
Owned For
Owner Type
Purchase Details
Closed on
Mar 26, 2009
Sold by
Hsbc Bank Usa
Bought by
Head Brandon and Head Erin
Current Estimated Value
Purchase Details
Closed on
Nov 19, 2004
Sold by
Swirtz Gregory P and Swirtz Molly Tompkins
Bought by
Shawn Mindak
Purchase Details
Closed on
Oct 24, 2003
Sold by
Vanbrocklin Randi L
Bought by
Swirtz Gregory P and Kaye Gary Martin
Create a Home Valuation Report for This Property
The Home Valuation Report is an in-depth analysis detailing your home's value as well as a comparison with similar homes in the area
Home Values in the Area
Average Home Value in this Area
Purchase History
| Date | Buyer | Sale Price | Title Company |
|---|---|---|---|
| Head Brandon | $289,000 | -- | |
| Shawn Mindak | $408,000 | -- | |
| Swirtz Gregory P | $250,800 | -- |
Source: Public Records
Tax History Compared to Growth
Tax History
| Year | Tax Paid | Tax Assessment Tax Assessment Total Assessment is a certain percentage of the fair market value that is determined by local assessors to be the total taxable value of land and additions on the property. | Land | Improvement |
|---|---|---|---|---|
| 2024 | $6,566 | $576,500 | $409,500 | $167,000 |
| 2023 | $6,177 | $569,300 | $269,700 | $299,600 |
| 2022 | $5,171 | $528,000 | $242,000 | $286,000 |
| 2021 | $5,034 | $437,000 | $188,000 | $249,000 |
| 2020 | $5,068 | $425,000 | $181,000 | $244,000 |
| 2019 | $4,988 | $411,000 | $177,000 | $234,000 |
| 2018 | $4,721 | $407,000 | $177,000 | $230,000 |
| 2017 | $4,468 | $365,000 | $177,000 | $188,000 |
| 2016 | $4,325 | $348,000 | $153,000 | $195,000 |
| 2015 | $3,934 | $317,000 | $140,000 | $177,000 |
| 2014 | -- | $279,000 | $121,000 | $158,000 |
Source: Public Records
Map
Nearby Homes
- 18065 Berry Ln
- 18545 Rutledge Rd
- 18540 Azure Rd
- 18800 Highland Avenue
- 18800 Highland Ave
- 3500 Leroy St
- 18925 Easton Rd
- 3922 Heathcote Rd
- 18505 Minnetonka Blvd
- 17820 Valley Cove Ct
- 3900 Hillcrest Way
- 18965 Lake Ave
- 19100 Rutledge Rd
- 3815 Deephaven Ave
- 3515 County Road 101
- 4195 Hillcrest Ln
- 4015 E Valley Rd
- 3655 Northome Rd
- 3205 County Road 101
- 3100 County Road 101 S
- 3605 3605 Westview Dr
- 3615 Westview Dr
- 3600 Westview Dr
- 18369 18369 Minnetonka-Boulevard-
- 18369 Minnetonka Blvd
- 3615 3615 Westview Dr
- xxxxx Highland Ave
- 3610 Westview Dr
- 3610 3610 Westview Dr
- 18275 18275 Carole Ln
- 18275 Carole Ln
- 18365 Minnetonka Blvd
- 3605 Montgomerie Ave
- 18361 Minnetonka Blvd
- 18361 18361 Minnetonka Blvd
- 3635 Westview Dr
- 3615 Montgomerie Ave
- 18352 Minnetonka Blvd
- 18275 Highland Ave
- 18175 Carole Ln