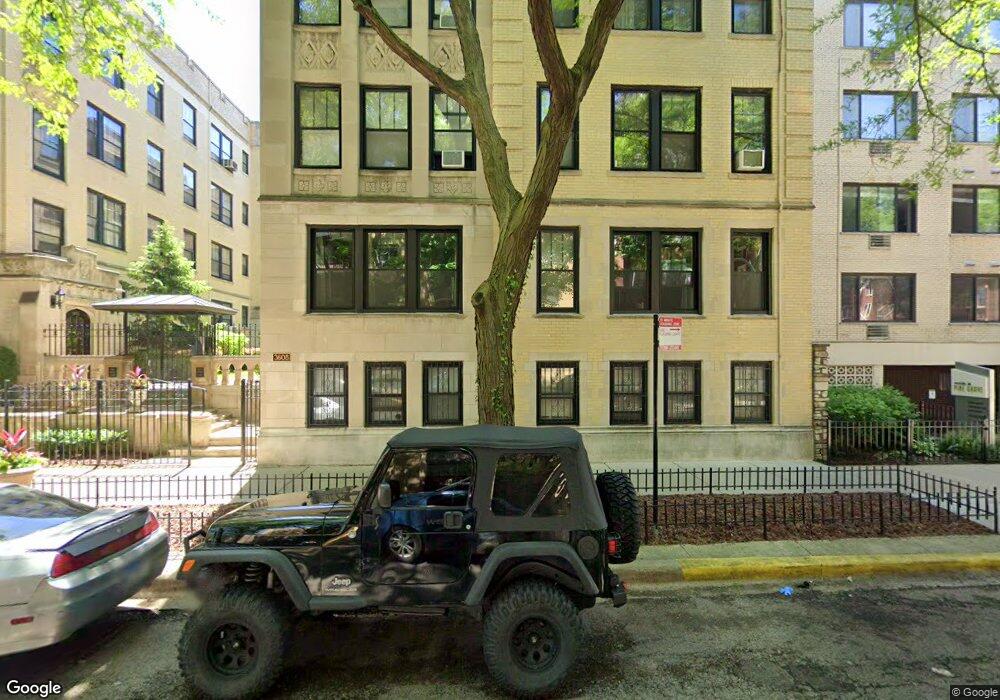
3606 N Pine Grove Ave Unit 3606 Chicago, IL 60613
Lakeview East NeighborhoodEstimated Value: $237,000 - $703,000
--
Bed
--
Bath
--
Sq Ft
0.34
Acres
About This Home
This home is located at 3606 N Pine Grove Ave Unit 3606, Chicago, IL 60613 and is currently estimated at $399,667. 3606 N Pine Grove Ave Unit 3606 is a home located in Cook County with nearby schools including Greeley Elementary School, Lake View High School, and Bernard Zell Anshe Emet Day School.
Ownership History
Date
Name
Owned For
Owner Type
Purchase Details
Closed on
Jun 5, 2023
Sold by
Westcott Justin
Bought by
Hulshof Ryan
Current Estimated Value
Home Financials for this Owner
Home Financials are based on the most recent Mortgage that was taken out on this home.
Original Mortgage
$636,000
Outstanding Balance
$620,082
Interest Rate
6.75%
Mortgage Type
New Conventional
Estimated Equity
-$220,415
Purchase Details
Closed on
Jul 23, 2021
Sold by
Westcott Justin and Grooms Scott
Bought by
Westcott Justin
Purchase Details
Closed on
Jun 14, 2017
Sold by
Brabec George W and Maun Brian W
Bought by
Westcott Justin M and Grooms Scott W
Home Financials for this Owner
Home Financials are based on the most recent Mortgage that was taken out on this home.
Original Mortgage
$488,000
Interest Rate
3.75%
Mortgage Type
New Conventional
Create a Home Valuation Report for This Property
The Home Valuation Report is an in-depth analysis detailing your home's value as well as a comparison with similar homes in the area
Home Values in the Area
Average Home Value in this Area
Purchase History
| Date | Buyer | Sale Price | Title Company |
|---|---|---|---|
| Hulshof Ryan | $795,000 | None Listed On Document | |
| Hulshof Ryan | $795,000 | None Listed On Document | |
| Westcott Justin | -- | Attorney | |
| Westcott Justin M | $610,000 | Attorney |
Source: Public Records
Mortgage History
| Date | Status | Borrower | Loan Amount |
|---|---|---|---|
| Open | Hulshof Ryan | $636,000 | |
| Closed | Hulshof Ryan | $636,000 | |
| Previous Owner | Westcott Justin M | $488,000 |
Source: Public Records
Tax History Compared to Growth
Tax History
| Year | Tax Paid | Tax Assessment Tax Assessment Total Assessment is a certain percentage of the fair market value that is determined by local assessors to be the total taxable value of land and additions on the property. | Land | Improvement |
|---|---|---|---|---|
| 2024 | $2,274 | $13,906 | $1,743 | $12,163 |
| 2023 | $2,217 | $10,780 | $1,558 | $9,222 |
| 2022 | $2,217 | $10,780 | $1,558 | $9,222 |
| 2021 | $2,168 | $10,779 | $1,557 | $9,222 |
| 2020 | $2,745 | $12,323 | $973 | $11,350 |
| 2019 | $2,729 | $13,584 | $973 | $12,611 |
| 2018 | $2,683 | $13,584 | $973 | $12,611 |
| 2017 | $1,987 | $9,229 | $856 | $8,373 |
| 2016 | $1,848 | $9,229 | $856 | $8,373 |
| 2015 | $1,691 | $9,229 | $856 | $8,373 |
| 2014 | $2,023 | $10,904 | $661 | $10,243 |
| 2013 | $1,983 | $10,904 | $661 | $10,243 |
Source: Public Records
Map
Nearby Homes
- 611 W Patterson Ave Unit 317
- 3620 N Pine Grove Ave Unit 504
- 625 W Addison St Unit 3
- 544 W Brompton Ave Unit 1G
- 3638 N Pine Grove Ave Unit G2
- 3660 N Lake Shore Dr Unit P-47
- 3660 N Lake Shore Dr Unit P048
- 3660 N Lake Shore Dr Unit 3301
- 3660 N Lake Shore Dr Unit 1015
- 3660 N Lake Shore Dr Unit 1407
- 3600 N Lake Shore Dr Unit 1323
- 3600 N Lake Shore Dr Unit 216
- 3600 N Lake Shore Dr Unit 2723
- 3600 N Lake Shore Dr Unit 2022
- 3600 N Lake Shore Dr Unit 1320
- 3600 N Lake Shore Dr Unit 1108
- 3600 N Lake Shore Dr Unit 1403
- 3600 N Lake Shore Dr Unit 502
- 3600 N Lake Shore Dr Unit 2204
- 3600 N Lake Shore Dr Unit 2223
- 3606 N Pine Grove Ave Unit 3K
- 3606 N Pine Grove Ave Unit 3606
- 3606 N Pine Grove Ave Unit 3606
- 3606 N Pine Grove Ave Unit 3606
- 3606 N Pine Grove Ave Unit 3606
- 3606 N Pine Grove Ave Unit 3606
- 3606 N Pine Grove Ave Unit 3606
- 3606 N Pine Grove Ave Unit 3606
- 3606 N Pine Grove Ave Unit 3606
- 3606 N Pine Grove Ave Unit 3606
- 3606 N Pine Grove Ave Unit 3606
- 3606 N Pine Grove Ave Unit 3606
- 3606 N Pine Grove Ave Unit 1J
- 3606 N Pine Grove Ave
- 3606 N Pine Grove Ave Unit 4KLM
- 3606 N Pine Grove Ave Unit 4J
- 3606 N Pine Grove Ave Unit 2J
- 3606 N Pine Grove Ave Unit 1L
- 3606 N Pine Grove Ave Unit IJ
- 3606 N Pine Grove Ave Unit 3L