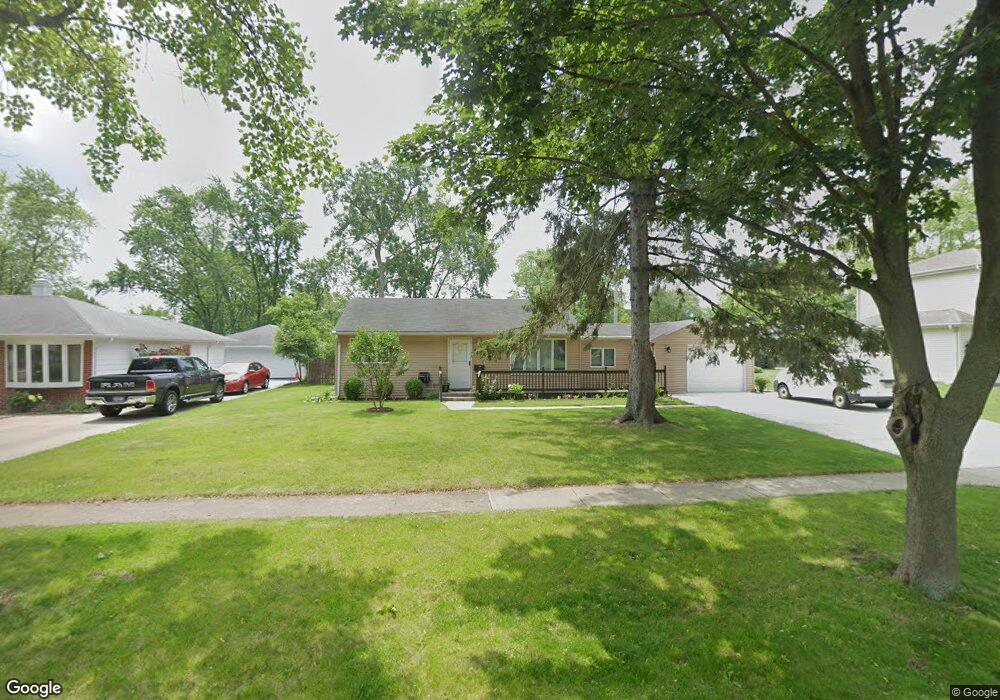
3606 Sigwalt St Rolling Meadows, IL 60008
Estimated Value: $316,000 - $340,527
3
Beds
2
Baths
1,207
Sq Ft
$276/Sq Ft
Est. Value
About This Home
This home is located at 3606 Sigwalt St, Rolling Meadows, IL 60008 and is currently estimated at $332,632, approximately $275 per square foot. 3606 Sigwalt St is a home located in Cook County with nearby schools including Kimball Hill Elementary School, King Elementary School, and Carl Sandburg Junior High School.
Ownership History
Date
Name
Owned For
Owner Type
Purchase Details
Closed on
Aug 31, 2010
Sold by
Miner Beth
Bought by
Chterev Dianko and Chtereva Minka
Current Estimated Value
Home Financials for this Owner
Home Financials are based on the most recent Mortgage that was taken out on this home.
Original Mortgage
$148,000
Outstanding Balance
$97,977
Interest Rate
4.49%
Mortgage Type
New Conventional
Estimated Equity
$234,655
Purchase Details
Closed on
Apr 27, 1999
Sold by
Miner Betty Jean
Bought by
The Betty Jean Miner Declaration Trust
Purchase Details
Closed on
Jun 19, 1997
Sold by
Raducka Joseph J
Bought by
Puleo Robert N and Puleo Kim M
Home Financials for this Owner
Home Financials are based on the most recent Mortgage that was taken out on this home.
Original Mortgage
$129,850
Interest Rate
8%
Create a Home Valuation Report for This Property
The Home Valuation Report is an in-depth analysis detailing your home's value as well as a comparison with similar homes in the area
Home Values in the Area
Average Home Value in this Area
Purchase History
| Date | Buyer | Sale Price | Title Company |
|---|---|---|---|
| Chterev Dianko | $185,000 | Cti | |
| The Betty Jean Miner Declaration Trust | -- | Chicago Title Insurance Co | |
| Puleo Robert N | $162,500 | -- |
Source: Public Records
Mortgage History
| Date | Status | Borrower | Loan Amount |
|---|---|---|---|
| Open | Chterev Dianko | $148,000 | |
| Previous Owner | Puleo Robert N | $129,850 |
Source: Public Records
Tax History Compared to Growth
Tax History
| Year | Tax Paid | Tax Assessment Tax Assessment Total Assessment is a certain percentage of the fair market value that is determined by local assessors to be the total taxable value of land and additions on the property. | Land | Improvement |
|---|---|---|---|---|
| 2024 | $5,481 | $23,851 | $6,072 | $17,779 |
| 2023 | $5,824 | $26,000 | $6,072 | $19,928 |
| 2022 | $5,824 | $26,000 | $6,072 | $19,928 |
| 2021 | $712 | $19,789 | $3,588 | $16,201 |
| 2020 | $647 | $19,789 | $3,588 | $16,201 |
| 2019 | $644 | $22,111 | $3,588 | $18,523 |
| 2018 | $718 | $19,297 | $3,312 | $15,985 |
| 2017 | $5,052 | $19,297 | $3,312 | $15,985 |
| 2016 | $4,966 | $19,297 | $3,312 | $15,985 |
| 2015 | $4,246 | $16,108 | $3,036 | $13,072 |
| 2014 | $4,883 | $18,458 | $3,036 | $15,422 |
| 2013 | $4,748 | $18,458 | $3,036 | $15,422 |
Source: Public Records
Map
Nearby Homes
- 3805 Fairfax Ave
- 3400 Wellington Ct Unit 306
- 2401 Rohlwing Rd
- 3265 Kirchoff Rd Unit 223
- 1 Foxcroft on Auburn
- 3355 Kirchoff Rd Unit 6A
- 3275 Kirchoff Rd Unit 337
- 2600 Brookwood Way Dr Unit 316
- 2600 Brookwood Way Dr Unit 305
- 2600 Brookwood Way Dr Unit 214
- 2600 Brookwood Unit 314
- 2600 Brookwood Way Dr Unit 212
- 3125 Town Square Dr Unit 408
- 2611 South St
- 3316 Trillium Cir
- 3600 Owl Dr
- 4301 Euclid Ave
- 2041 Vermont St
- 160 E Forest Ln
- 3208 Wren Ln