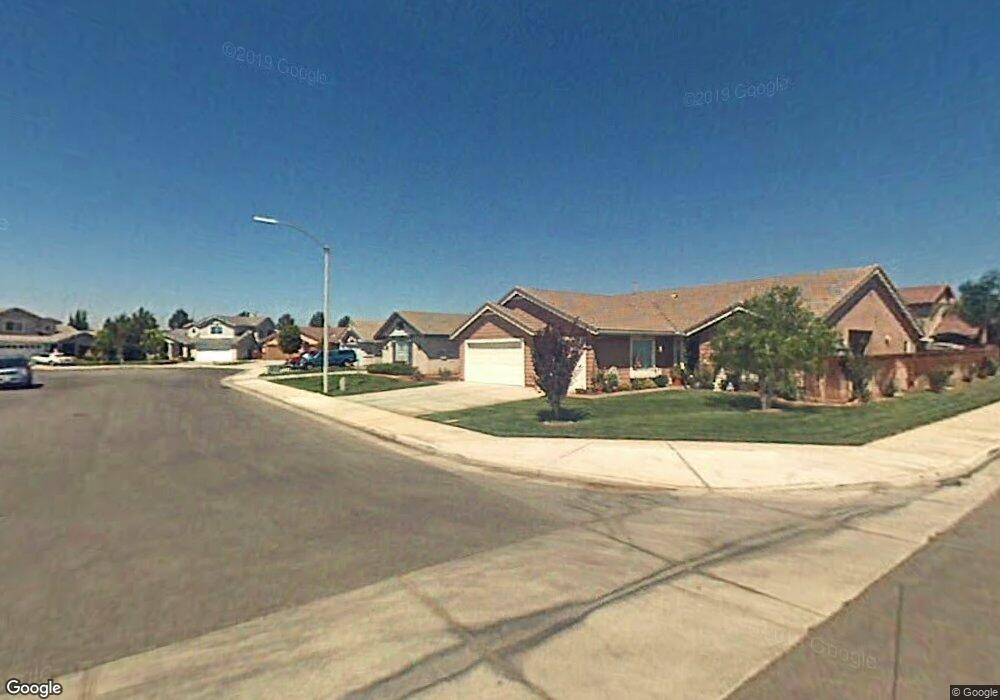
36066 Dresden Ct Winchester, CA 92596
Estimated Value: $633,000 - $643,000
4
Beds
3
Baths
2,123
Sq Ft
$301/Sq Ft
Est. Value
About This Home
This home is located at 36066 Dresden Ct, Winchester, CA 92596 and is currently estimated at $638,729, approximately $300 per square foot. 36066 Dresden Ct is a home located in Riverside County with nearby schools including French Valley Elementary School, Bella Vista Middle School, and Chaparral High School.
Ownership History
Date
Name
Owned For
Owner Type
Purchase Details
Closed on
Apr 4, 2024
Sold by
Shaw Robert B and Shaw Yolanda C
Bought by
Robert And Yolanda Shaw Trust and Shaw
Current Estimated Value
Purchase Details
Closed on
Aug 5, 2005
Sold by
Shaw Robert B
Bought by
Shaw Robert B and Shaw Yolanda C
Purchase Details
Closed on
Jan 18, 2004
Sold by
Nicholls Marvin Louis and Nicholls Jill Mattsson
Bought by
Shaw Robert B
Home Financials for this Owner
Home Financials are based on the most recent Mortgage that was taken out on this home.
Original Mortgage
$272,800
Interest Rate
5.61%
Mortgage Type
Balloon
Purchase Details
Closed on
May 26, 2000
Sold by
Barratt American Inc
Bought by
Nicholls Marvin Louis and Nicholls Jill Mattsson
Home Financials for this Owner
Home Financials are based on the most recent Mortgage that was taken out on this home.
Original Mortgage
$190,000
Interest Rate
7.86%
Create a Home Valuation Report for This Property
The Home Valuation Report is an in-depth analysis detailing your home's value as well as a comparison with similar homes in the area
Home Values in the Area
Average Home Value in this Area
Purchase History
| Date | Buyer | Sale Price | Title Company |
|---|---|---|---|
| Robert And Yolanda Shaw Trust | -- | None Listed On Document | |
| Shaw Robert B | -- | -- | |
| Shaw Robert B | $341,000 | First American Title Co | |
| Nicholls Marvin Louis | $200,500 | Fidelity National Title Co |
Source: Public Records
Mortgage History
| Date | Status | Borrower | Loan Amount |
|---|---|---|---|
| Previous Owner | Shaw Robert B | $272,800 | |
| Previous Owner | Nicholls Marvin Louis | $190,000 |
Source: Public Records
Tax History
| Year | Tax Paid | Tax Assessment Tax Assessment Total Assessment is a certain percentage of the fair market value that is determined by local assessors to be the total taxable value of land and additions on the property. | Land | Improvement |
|---|---|---|---|---|
| 2025 | $5,293 | $484,799 | $99,509 | $385,290 |
| 2023 | $5,293 | $465,976 | $95,646 | $370,330 |
| 2022 | $5,119 | $456,840 | $93,771 | $363,069 |
| 2021 | $4,999 | $447,883 | $91,933 | $355,950 |
| 2020 | $4,592 | $412,412 | $84,625 | $327,787 |
| 2019 | $4,481 | $400,400 | $82,160 | $318,240 |
| 2018 | $4,325 | $385,000 | $79,000 | $306,000 |
| 2017 | $3,987 | $352,000 | $72,000 | $280,000 |
| 2016 | $3,783 | $333,000 | $68,000 | $265,000 |
| 2015 | $3,615 | $318,000 | $65,000 | $253,000 |
| 2014 | $3,436 | $304,000 | $62,000 | $242,000 |
Source: Public Records
Map
Nearby Homes
- 36143 Tahoe St
- 31238 Jan Steen Ct
- 31659 Poppy St
- 36171 Joltaire Way
- 31429 Amsterdam Rd
- 36377 Capri Dr
- 31460 Tulette Ln
- 31556 Umbria Ln
- 31579 Mccartney Dr
- 31110 Calle Sagres
- 35622 Denver Cir
- 31771 Biagio Way
- 36562 Van Gaale Ln
- 35610 Denver Cir
- 31692 Pompei Ln
- 36293 Fabrizio Ln
- 31856 Granville Dr
- 35602 Driftwood St
- 36329 Albus Ave
- 36365 Grazia Way
- 36056 Dresden Ct
- 36065 Breman Ct
- 36055 Breman Ct
- 36046 Dresden Ct
- 31371 Bradford St
- 31361 Bradford St
- 36045 Breman Ct
- 31381 Bradford St
- 36069 Dresden Ct
- 36059 Dresden Ct
- 31351 Bradford St
- 31391 Bradford St
- 36036 Dresden Ct
- 36049 Dresden Ct
- 36035 Breman Ct
- 36026 Dresden Ct
- 31341 Bradford St
- 31401 Bradford St
- 36167 Forest St
- 36177 Forest St
Your Personal Tour Guide
Ask me questions while you tour the home.