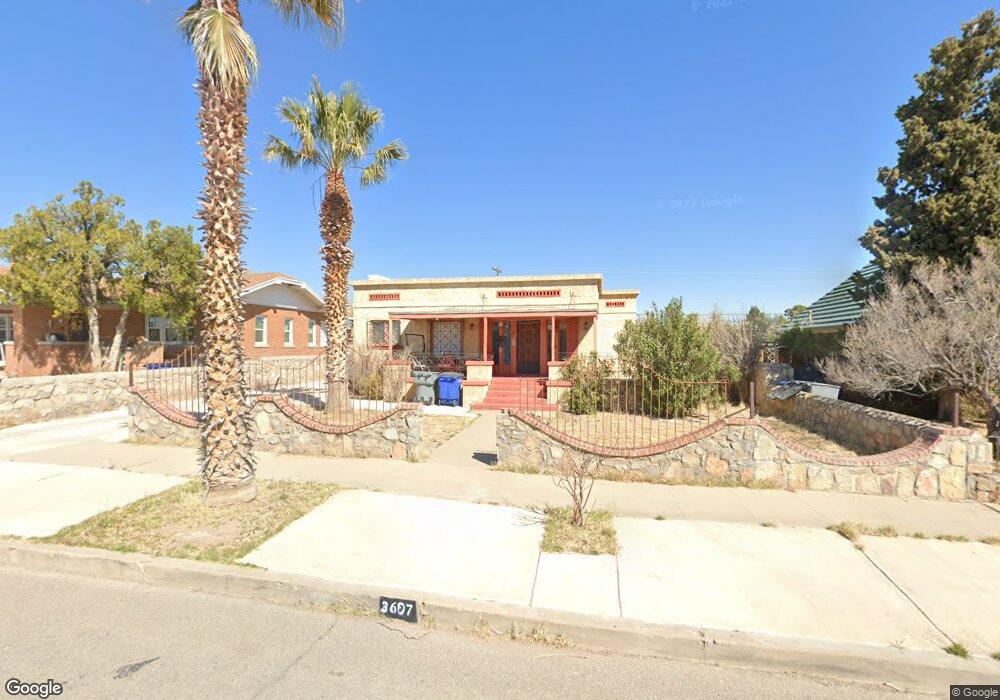
3607 Mckinley Ave El Paso, TX 79930
Central NeighborhoodEstimated Value: $183,437 - $204,000
--
Bed
2
Baths
1,284
Sq Ft
$151/Sq Ft
Est. Value
About This Home
This home is located at 3607 Mckinley Ave, El Paso, TX 79930 and is currently estimated at $193,859, approximately $150 per square foot. 3607 Mckinley Ave is a home located in El Paso County with nearby schools including Rusk Elementary School, Middle School-5 NW Middle, and Austin High School.
Ownership History
Date
Name
Owned For
Owner Type
Purchase Details
Closed on
Dec 16, 2008
Sold by
Dunn Estela
Bought by
Molinar Ralph G
Current Estimated Value
Purchase Details
Closed on
Dec 1, 2008
Sold by
Perez Elena
Bought by
Molinar Ralph G
Purchase Details
Closed on
Nov 26, 2008
Sold by
Fontenot Yolanda
Bought by
Molinar Ralph G
Purchase Details
Closed on
Nov 25, 2008
Sold by
Molinar Jesus
Bought by
Molinar Ralph G
Purchase Details
Closed on
Nov 19, 2008
Sold by
Chavez Maria Isela and Chavez Marisela
Bought by
Molinar Ralph G
Purchase Details
Closed on
Nov 18, 2008
Sold by
Quintana Mary Lou
Bought by
Molinar Ralph G
Purchase Details
Closed on
Nov 9, 2008
Sold by
Molinar Oscar
Bought by
Molinar Ralph G
Purchase Details
Closed on
Apr 15, 1999
Sold by
Duran Consuelo M
Bought by
Molinar Ralph G and Molinar Maria L
Create a Home Valuation Report for This Property
The Home Valuation Report is an in-depth analysis detailing your home's value as well as a comparison with similar homes in the area
Home Values in the Area
Average Home Value in this Area
Purchase History
| Date | Buyer | Sale Price | Title Company |
|---|---|---|---|
| Molinar Ralph G | -- | None Available | |
| Molinar Ralph G | -- | None Available | |
| Molinar Ralph G | -- | None Available | |
| Molinar Ralph G | -- | None Available | |
| Molinar Ralph G | -- | None Available | |
| Molinar Ralph G | -- | None Available | |
| Molinar Ralph G | -- | None Available | |
| Molinar Ralph G | -- | None Available | |
| Molinar Ralph G | -- | None Available |
Source: Public Records
Tax History Compared to Growth
Tax History
| Year | Tax Paid | Tax Assessment Tax Assessment Total Assessment is a certain percentage of the fair market value that is determined by local assessors to be the total taxable value of land and additions on the property. | Land | Improvement |
|---|---|---|---|---|
| 2025 | $1,421 | $137,955 | -- | -- |
| 2024 | $1,421 | $125,414 | -- | -- |
| 2023 | $1,342 | $114,013 | $0 | $0 |
| 2022 | $3,068 | $103,648 | $0 | $0 |
| 2021 | $2,942 | $94,225 | $16,134 | $78,091 |
| 2020 | $2,654 | $86,340 | $16,134 | $70,206 |
| 2018 | $2,437 | $85,698 | $16,134 | $69,564 |
| 2017 | $2,109 | $74,859 | $16,134 | $58,725 |
| 2016 | $2,109 | $74,859 | $16,134 | $58,725 |
| 2015 | $1,188 | $80,732 | $16,134 | $64,598 |
| 2014 | $1,188 | $80,455 | $16,134 | $64,321 |
Source: Public Records
Map
Nearby Homes
- 3704 Mckinley Ave
- 3806 Mountain Ave
- 3606 Morehead Ave
- 3831 Mountain Ave
- 3413 Monroe Ave
- 3901 Mckinley Ave
- 3905 Monroe Ave
- 3921 Nations Ave
- 3510 Porter Ave
- 3501 Polk Ave
- 3827 Idalia Ave
- 3104 Van Buren Ave
- 3427 Hamilton Ave
- 3312 Polk Ave
- 3501 Taylor Ave
- 3906 Taylor Ave
- 3027 Morehead Ave
- 3021 Monroe Ave
- 3031 Fort Blvd
- 3125 Hamilton Ave
- 3601 Mckinley Ave
- 3615 Mckinley Ave
- 3604 Jackson Ave
- 3600 Jackson Ave
- 3608 Jackson Ave
- 3621 Mckinley Ave
- 3600 Mckinley Ave
- 3525 Mckinley Ave
- 3525 Mckinley Ave
- 3612 Jackson Ave
- 3614 Mckinley Ave
- 3530 Jackson Ave
- 3618 Mckinley Ave
- 3616 Jackson Ave
- 3530 Mckinley Ave
- 3517 Mckinley Ave
- 3517 Mckinley Ave
- 3517 Mckinley Ave Unit 1
- 3622 Mckinley Ave
- 3631 Mckinley Ave