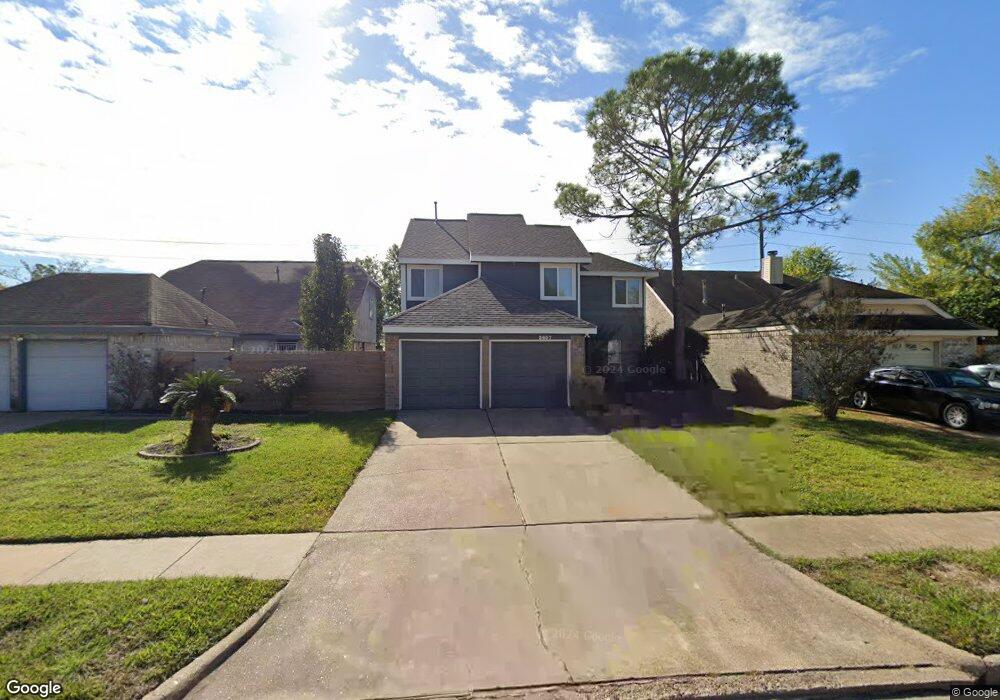
3607 Storm Creek Dr Houston, TX 77088
Greater Inwood NeighborhoodEstimated Value: $228,000 - $243,000
4
Beds
3
Baths
1,938
Sq Ft
$121/Sq Ft
Est. Value
About This Home
This home is located at 3607 Storm Creek Dr, Houston, TX 77088 and is currently estimated at $233,657, approximately $120 per square foot. 3607 Storm Creek Dr is a home located in Harris County with nearby schools including Stovall School, Caraway Intermediate School, and Caraway Elementary School.
Ownership History
Date
Name
Owned For
Owner Type
Purchase Details
Closed on
Sep 14, 2007
Sold by
Berryman John Gary
Bought by
Berryman Julie and Friedman Julie A
Current Estimated Value
Home Financials for this Owner
Home Financials are based on the most recent Mortgage that was taken out on this home.
Original Mortgage
$77,550
Outstanding Balance
$49,250
Interest Rate
6.63%
Mortgage Type
Purchase Money Mortgage
Estimated Equity
$184,407
Purchase Details
Closed on
Apr 26, 2002
Sold by
Berryman Julie
Bought by
Berryman John Gary
Purchase Details
Closed on
Aug 31, 1995
Sold by
Bankers Trust Company Of California Na
Bought by
Friedman Julie A
Home Financials for this Owner
Home Financials are based on the most recent Mortgage that was taken out on this home.
Original Mortgage
$53,650
Interest Rate
7.76%
Purchase Details
Closed on
Feb 7, 1995
Sold by
Brandin Chris E and Brandin Alexia A
Bought by
Bankers Trust Company Of California Na and Rtc Mtg Pass Through Certificate Series
Create a Home Valuation Report for This Property
The Home Valuation Report is an in-depth analysis detailing your home's value as well as a comparison with similar homes in the area
Home Values in the Area
Average Home Value in this Area
Purchase History
| Date | Buyer | Sale Price | Title Company |
|---|---|---|---|
| Berryman Julie | -- | Charter Title Company | |
| Berryman John Gary | -- | -- | |
| Friedman Julie A | -- | Regency Title | |
| Bankers Trust Company Of California Na | $45,050 | -- |
Source: Public Records
Mortgage History
| Date | Status | Borrower | Loan Amount |
|---|---|---|---|
| Open | Berryman Julie | $77,550 | |
| Previous Owner | Friedman Julie A | $53,650 | |
| Closed | Friedman Julie A | $2,346 |
Source: Public Records
Tax History Compared to Growth
Tax History
| Year | Tax Paid | Tax Assessment Tax Assessment Total Assessment is a certain percentage of the fair market value that is determined by local assessors to be the total taxable value of land and additions on the property. | Land | Improvement |
|---|---|---|---|---|
| 2025 | $2,512 | $216,210 | $38,840 | $177,370 |
| 2024 | $2,512 | $212,864 | $38,840 | $174,024 |
| 2023 | $2,512 | $223,468 | $44,226 | $179,242 |
| 2022 | $3,454 | $191,453 | $29,484 | $161,969 |
| 2021 | $3,288 | $150,871 | $20,393 | $130,478 |
| 2020 | $3,141 | $142,738 | $20,393 | $122,345 |
| 2019 | $2,994 | $130,849 | $12,776 | $118,073 |
| 2018 | $1,053 | $120,739 | $12,776 | $107,963 |
| 2017 | $2,372 | $120,739 | $12,776 | $107,963 |
| 2016 | $2,156 | $113,590 | $12,776 | $100,814 |
| 2015 | $1,419 | $101,784 | $12,776 | $89,008 |
| 2014 | $1,419 | $67,174 | $12,776 | $54,398 |
Source: Public Records
Map
Nearby Homes
- 8510 Woodcamp Dr
- 8518 Wild Basin Dr
- 7814 Inwood Grove Ln
- 7808 Inwood Grove Ln
- 7717 Inwood Hills Ln
- 7702 Inwood Hills Ln
- 7716 Inwood Grove Ln
- 7718 Inwood Grove Ln
- 7709 Inwood Hills Ln
- 7712 Inwood Grove Ln
- 7707 Inwood Grove Ln
- 7705 Inwood Grove Ln
- DOVE Plan at Alaia Crossing
- CEDAR Plan at Alaia Crossing
- BOXWOOD Plan at Alaia Crossing
- 7816 Inwood Grove Ln
- 3522 Almington Ln
- 8711 Wild Basin Dr
- 7610 Alperton Dr
- 8814 Woodcamp Dr
- 3611 Storm Creek Dr
- 3603 Storm Creek Dr
- 3615 Storm Creek Dr
- 3619 Storm Creek Dr
- 3622 Abinger Ln
- 3618 Abinger Ln
- 3623 Storm Creek Dr
- 3626 Abinger Ln
- 8410 Scenic Green Dr
- 3606 Storm Creek Dr
- 8414 Scenic Green Dr
- 3602 Storm Creek Dr
- 3610 Storm Creek Dr
- 8418 Scenic Green Dr
- 3630 Abinger Ln
- 3614 Storm Creek Dr
- 3627 Storm Creek Dr
- 8502 Scenic Green Dr
- 3622 Storm Creek Dr
- 3610 Abinger Ln