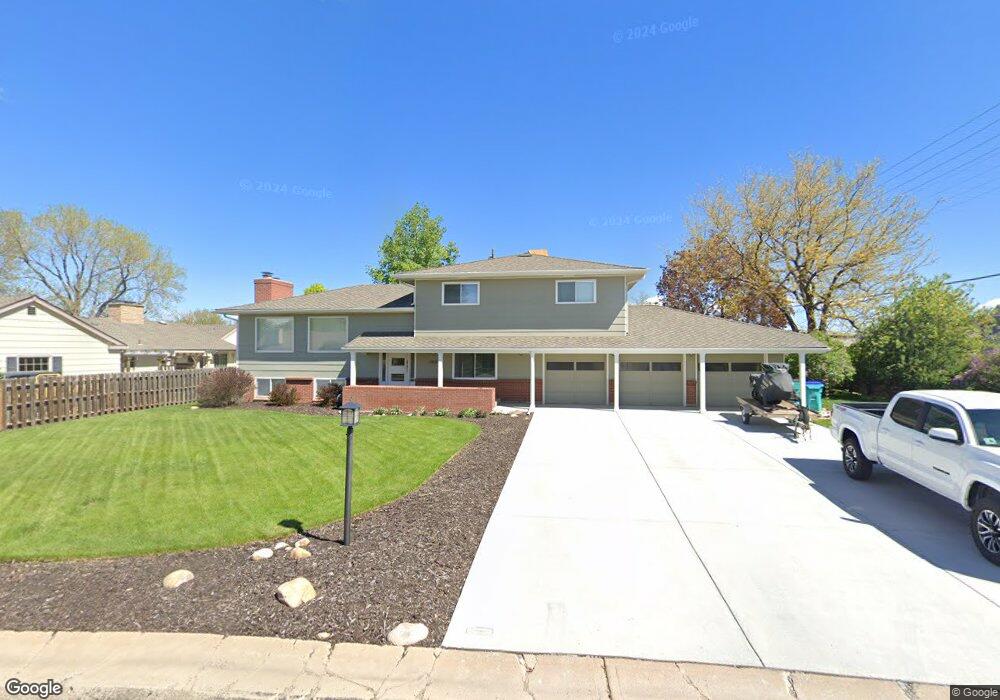
3607 Yucca Place Loveland, CO 80538
Estimated Value: $666,261 - $936,000
3
Beds
3
Baths
2,585
Sq Ft
$304/Sq Ft
Est. Value
About This Home
This home is located at 3607 Yucca Place, Loveland, CO 80538 and is currently estimated at $784,565, approximately $303 per square foot. 3607 Yucca Place is a home located in Larimer County with nearby schools including High Plains School, Mountain View High School, and New Vision Charter School.
Ownership History
Date
Name
Owned For
Owner Type
Purchase Details
Closed on
Mar 26, 2010
Sold by
Wilson Dennis M and Hershman Phillip D
Bought by
Wilson Dennis M and Hershman Phillip D
Current Estimated Value
Home Financials for this Owner
Home Financials are based on the most recent Mortgage that was taken out on this home.
Original Mortgage
$234,000
Interest Rate
4.96%
Mortgage Type
New Conventional
Purchase Details
Closed on
Nov 1, 2001
Sold by
Hallock James H and Hallock Linda F
Bought by
Hershman Phillip D and Wilson Dennis M
Home Financials for this Owner
Home Financials are based on the most recent Mortgage that was taken out on this home.
Original Mortgage
$176,000
Interest Rate
6.77%
Purchase Details
Closed on
Nov 22, 1996
Sold by
Hallock James H
Bought by
Hallock James H and Hallock Linda F
Purchase Details
Closed on
Feb 1, 1994
Sold by
Hollingsworth Jay E
Bought by
Hallock James H
Purchase Details
Closed on
Mar 1, 1992
Sold by
White Jane E
Bought by
Hollingsworth Jay E
Create a Home Valuation Report for This Property
The Home Valuation Report is an in-depth analysis detailing your home's value as well as a comparison with similar homes in the area
Home Values in the Area
Average Home Value in this Area
Purchase History
| Date | Buyer | Sale Price | Title Company |
|---|---|---|---|
| Wilson Dennis M | -- | None Available | |
| Hershman Phillip D | $220,000 | Chicago Title Co | |
| Hallock James H | -- | -- | |
| Hallock James H | $169,000 | -- | |
| Hollingsworth Jay E | $132,000 | -- |
Source: Public Records
Mortgage History
| Date | Status | Borrower | Loan Amount |
|---|---|---|---|
| Closed | Wilson Dennis M | $234,000 | |
| Closed | Hershman Phillip D | $176,000 |
Source: Public Records
Tax History Compared to Growth
Tax History
| Year | Tax Paid | Tax Assessment Tax Assessment Total Assessment is a certain percentage of the fair market value that is determined by local assessors to be the total taxable value of land and additions on the property. | Land | Improvement |
|---|---|---|---|---|
| 2025 | $3,438 | $45,908 | $12,730 | $33,178 |
| 2024 | $3,318 | $45,908 | $12,730 | $33,178 |
| 2022 | $2,587 | $32,811 | $11,468 | $21,343 |
| 2021 | $2,655 | $33,756 | $11,798 | $21,958 |
| 2020 | $2,889 | $36,730 | $11,798 | $24,932 |
| 2019 | $2,840 | $36,730 | $11,798 | $24,932 |
| 2018 | $2,529 | $31,039 | $10,440 | $20,599 |
| 2017 | $2,176 | $31,039 | $10,440 | $20,599 |
| 2016 | $1,899 | $26,189 | $5,254 | $20,935 |
| 2015 | $1,883 | $26,180 | $5,250 | $20,930 |
| 2014 | $1,860 | $25,010 | $4,700 | $20,310 |
Source: Public Records
Map
Nearby Homes
- 4103 N Park Dr
- 4105 N Park Dr
- 3553 Valley Oak Dr
- 4110 S Park Dr
- 4109 Park Dr
- 3326 Ice Lake Ct
- 4105 Park Dr
- 4103 Park Dr
- 3997 Forest Lake Ct
- 4144 S Park Dr Unit 102
- 4160 S Park Dr Unit 201
- 4160 S Park Dr Unit 202
- 4160 S Park Dr Unit 200
- 3804 Amy Place
- 4185 N Park Dr Unit 201
- 4183 Chasm Lake Dr
- 4180 S Park Dr Unit 201
- 3096 Bridal Veil Falls Dr
- 4250 Persigo Trail Dr Unit 307
- 3095 Deering Lake Dr
- 3410 Valley Oak Dr
- 3812 Yucca Place
- 3812 Tundra Place
- 3434 Valley Oak Dr
- 3354 Valley Oak Dr
- 3471R Ralston Creek Dr
- 3471 Ralston Creek Dr
- 3463 Ralston Creek Dr
- 3485 Ralston Creek Dr
- 3477 Ralston Creek Dr
- 3455 Ralston Creek Dr
- 3401 Valley Oak Dr
- 3491 Ralston Creek Dr
- 3421 Valley Oak Dr
- 3344 Valley Oak Dr
- 3449 Ralston Creek Dr
- 3499 Ralston Creek Dr
- 3357 Valley Oak Dr
- 3441 Ralston Creek Dr
- 3503 Ralston Creek Dr