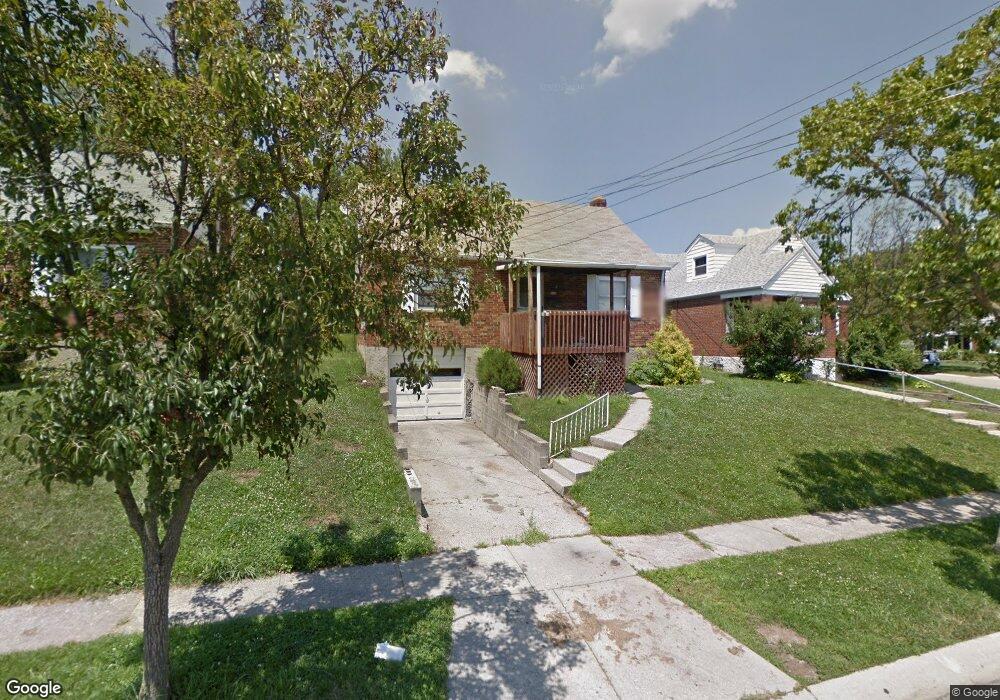
3608 Allview Cir Cincinnati, OH 45238
Westwood NeighborhoodEstimated Value: $158,000 - $223,000
4
Beds
2
Baths
1,591
Sq Ft
$122/Sq Ft
Est. Value
About This Home
This home is located at 3608 Allview Cir, Cincinnati, OH 45238 and is currently estimated at $193,650, approximately $121 per square foot. 3608 Allview Cir is a home located in Hamilton County with nearby schools including Midway Elementary School, Western Hills High School, and Gilbert A. Dater High School.
Ownership History
Date
Name
Owned For
Owner Type
Purchase Details
Closed on
Jan 10, 2008
Sold by
Durso John and Durso Kathleen A
Bought by
Thursday Investments Llc
Current Estimated Value
Purchase Details
Closed on
Jan 9, 2007
Sold by
Roeck Gerald A and Roeck Janice M
Bought by
Durso John R
Home Financials for this Owner
Home Financials are based on the most recent Mortgage that was taken out on this home.
Original Mortgage
$74,700
Interest Rate
6.62%
Mortgage Type
Unknown
Create a Home Valuation Report for This Property
The Home Valuation Report is an in-depth analysis detailing your home's value as well as a comparison with similar homes in the area
Home Values in the Area
Average Home Value in this Area
Purchase History
| Date | Buyer | Sale Price | Title Company |
|---|---|---|---|
| Thursday Investments Llc | -- | Attorney | |
| Durso John R | $83,000 | Attorney |
Source: Public Records
Mortgage History
| Date | Status | Borrower | Loan Amount |
|---|---|---|---|
| Previous Owner | Durso John R | $74,700 |
Source: Public Records
Tax History
| Year | Tax Paid | Tax Assessment Tax Assessment Total Assessment is a certain percentage of the fair market value that is determined by local assessors to be the total taxable value of land and additions on the property. | Land | Improvement |
|---|---|---|---|---|
| 2025 | $2,842 | $44,667 | $6,027 | $38,640 |
| 2024 | $2,838 | $44,667 | $6,027 | $38,640 |
| 2023 | $2,843 | $44,667 | $6,027 | $38,640 |
| 2022 | $1,809 | $25,491 | $4,893 | $20,598 |
| 2021 | $1,775 | $25,491 | $4,893 | $20,598 |
| 2020 | $1,780 | $25,491 | $4,893 | $20,598 |
| 2019 | $1,778 | $23,174 | $4,449 | $18,725 |
| 2018 | $1,779 | $23,174 | $4,449 | $18,725 |
| 2017 | $1,713 | $23,174 | $4,449 | $18,725 |
| 2016 | $1,671 | $22,050 | $5,166 | $16,884 |
| 2015 | $1,494 | $22,050 | $5,166 | $16,884 |
| 2014 | $1,831 | $26,905 | $5,166 | $21,739 |
| 2013 | $1,939 | $28,028 | $5,383 | $22,645 |
Source: Public Records
Map
Nearby Homes
- 3531 Werk Rd
- 2299 Townhill Rd
- 2710 Carroll Ave
- 5487 Belcross Ct
- 2195 Woodmere Ct
- 3004 Glenmore Ave
- 2985 Welge Ln
- 5461 Bellfield Ln
- 3281 Pickbury Dr
- 5375 Werk Rd
- 3305 Queen City Ave
- 5524 Sidney Rd
- 3230 Stanhope Ave
- 3599 Schwartze Ave
- 3238 Buell St
- 5448 Robert Ave
- 3157 Westbourne Dr
- 3244 Glenmore Ave
- 3317 Buell St
- 3617 Fieldcrest Dr
- 3612 Allview Cir
- 3604 Allview Cir
- 2835 Allview Cir
- 3616 Allview Cir
- 3615 Allview Ct
- 3620 Allview Cir
- 3609 Allview Cir
- 3613 Allview Cir
- 3605 Allview Cir
- 3619 Allview Ct
- 3617 Allview Cir
- 2826 Allview Cir
- 2830 Allview Cir
- 2843 Allview Cir
- 3624 Allview Cir
- 2822 Allview Cir
- 2834 Allview Cir
- 3621 Allview Cir
- 3614 Allview Ct
- 2818 Allview Cir
Your Personal Tour Guide
Ask me questions while you tour the home.