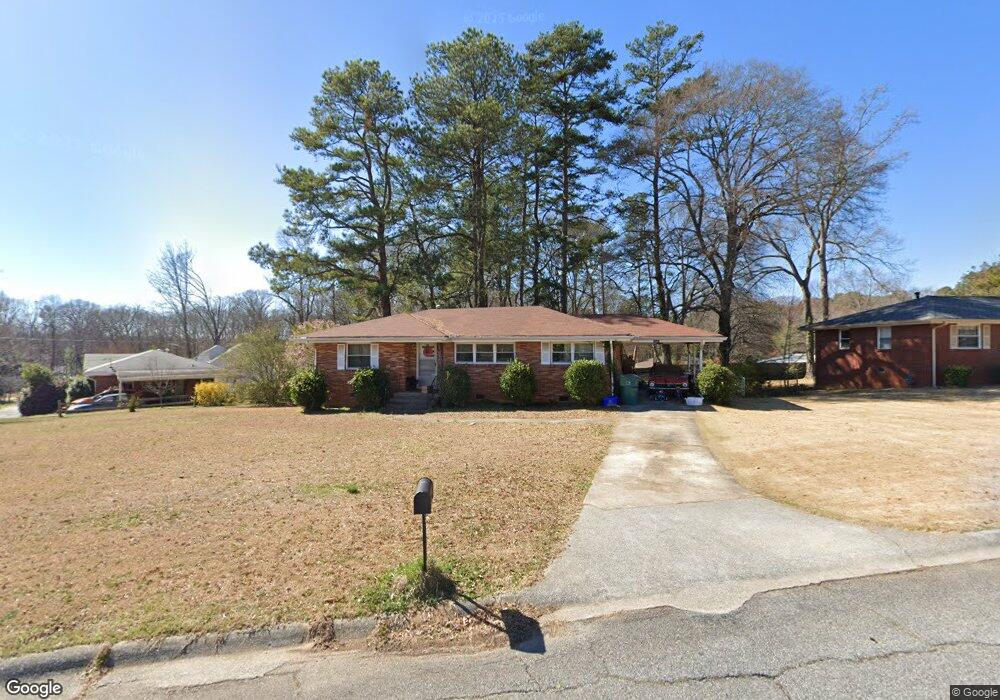
3608 Crestview Dr SE Smyrna, GA 30082
Estimated Value: $282,000 - $381,000
3
Beds
2
Baths
1,228
Sq Ft
$283/Sq Ft
Est. Value
About This Home
This home is located at 3608 Crestview Dr SE, Smyrna, GA 30082 and is currently estimated at $347,061, approximately $282 per square foot. 3608 Crestview Dr SE is a home located in Cobb County with nearby schools including King Springs Elementary School, Griffin Middle School, and Campbell High School.
Ownership History
Date
Name
Owned For
Owner Type
Purchase Details
Closed on
Dec 3, 2009
Sold by
Birkinbine Paul and Birkinbine Elizabeth
Bought by
Birkinbine Paul and Birkinbine Elizabeth
Current Estimated Value
Home Financials for this Owner
Home Financials are based on the most recent Mortgage that was taken out on this home.
Original Mortgage
$131,461
Outstanding Balance
$85,883
Interest Rate
5.01%
Mortgage Type
FHA
Estimated Equity
$261,178
Purchase Details
Closed on
May 12, 2008
Sold by
Brideau Mary
Bought by
Horner Elizabeth and Birkinbine Paul
Home Financials for this Owner
Home Financials are based on the most recent Mortgage that was taken out on this home.
Original Mortgage
$104,854
Interest Rate
6%
Mortgage Type
FHA
Create a Home Valuation Report for This Property
The Home Valuation Report is an in-depth analysis detailing your home's value as well as a comparison with similar homes in the area
Home Values in the Area
Average Home Value in this Area
Purchase History
| Date | Buyer | Sale Price | Title Company |
|---|---|---|---|
| Birkinbine Paul | -- | -- | |
| Horner Elizabeth | $106,500 | -- |
Source: Public Records
Mortgage History
| Date | Status | Borrower | Loan Amount |
|---|---|---|---|
| Open | Birkinbine Paul | $131,461 | |
| Previous Owner | Horner Elizabeth | $104,854 |
Source: Public Records
Tax History Compared to Growth
Tax History
| Year | Tax Paid | Tax Assessment Tax Assessment Total Assessment is a certain percentage of the fair market value that is determined by local assessors to be the total taxable value of land and additions on the property. | Land | Improvement |
|---|---|---|---|---|
| 2025 | $2,548 | $123,128 | $52,000 | $71,128 |
| 2024 | $3,021 | $148,412 | $52,000 | $96,412 |
| 2023 | $2,041 | $122,116 | $40,000 | $82,116 |
| 2022 | $2,268 | $107,104 | $34,000 | $73,104 |
| 2021 | $1,987 | $91,620 | $26,000 | $65,620 |
| 2020 | $1,979 | $91,168 | $26,000 | $65,168 |
| 2019 | $1,817 | $82,660 | $24,000 | $58,660 |
| 2018 | $1,562 | $69,276 | $24,000 | $45,276 |
| 2017 | $1,249 | $58,380 | $24,000 | $34,380 |
| 2016 | $1,172 | $55,372 | $24,000 | $31,372 |
| 2015 | $919 | $44,660 | $23,940 | $20,720 |
| 2014 | $928 | $44,660 | $0 | $0 |
Source: Public Records
Map
Nearby Homes
- 1024 Magnolia Dr SE
- 3543 S Cobb Dr SE
- 3568 Lake Dr SE
- 3654 Lake Dr SE
- 1019 Magbee Dr SE
- 982 Oakdale Dr SE
- 116 Festoon Ct
- 1042 Oakdale Dr SE
- 1044 Pinedale Dr SE
- 305 Berkeley Ct SE
- 1005 Pinedale Dr SE
- 4222 Terrace Ct SE
- 1060 Pinedale Dr SE
- 303 Mill Pond Ct SE
- 1522 Grace Meadows Ln SE
- 3538 S Sherwood Rd SE Unit 5
- 606 Mill Pond Dr SE
- 609 Mill Pond Dr SE
- 610 Mill Pond Dr SE
- 3600 Crestview Dr SE
- 963 Magnolia Dr SE
- 3601 Crestview Dr SE
- 951 Magnolia Dr SE
- 974 Magnolia Dr SE
- 964 Magnolia Dr SE
- 942 Shirley St SE
- 3621 Crestview Dr SE
- 3591 Crestview Dr SE Unit A
- 932 Shirley St SE
- 3580 Crestview Dr SE
- 956 Magnolia Dr SE
- 3615 Westbrook Dr SE
- 3603 Westbrook Dr SE
- 3625 Westbrook Dr SE
- 3625 Westbrook Dr SE Unit 455
- 3625 Westbrook 3625 Westbrook Dr SE Unit 455
- 996 Magnolia Dr SE
- 3634 Crestview Dr SE
- 3631 Crestview Dr SE