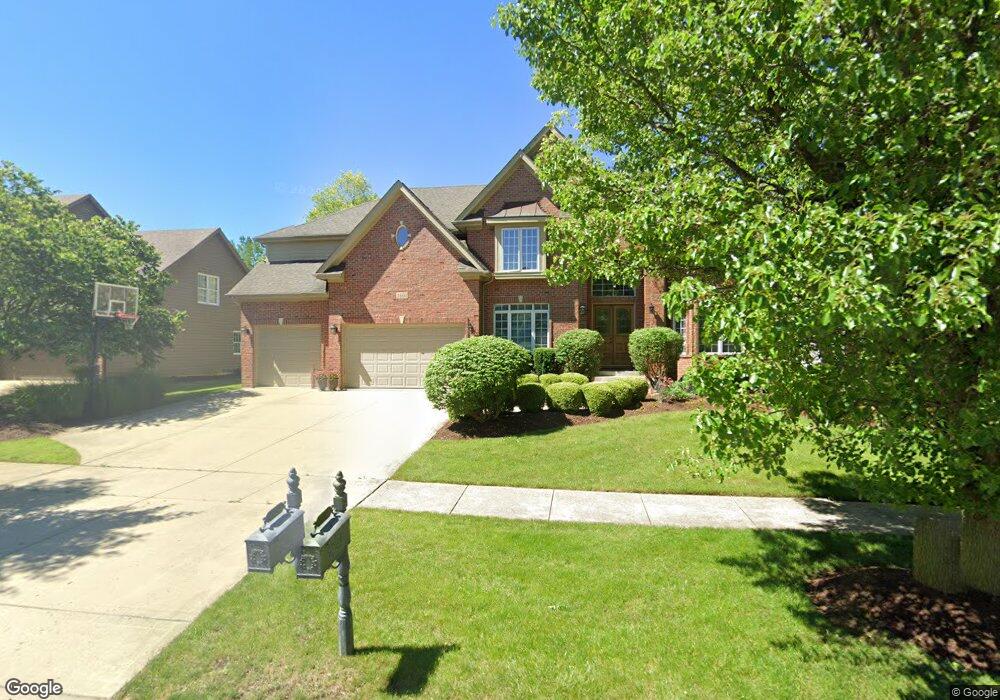
3608 Hector Ln Unit 6 Naperville, IL 60564
Tall Grass NeighborhoodEstimated Value: $1,032,000 - $1,368,000
7
Beds
7
Baths
4,508
Sq Ft
$254/Sq Ft
Est. Value
About This Home
This home is located at 3608 Hector Ln Unit 6, Naperville, IL 60564 and is currently estimated at $1,145,246, approximately $254 per square foot. 3608 Hector Ln Unit 6 is a home located in Will County with nearby schools including Fry Elementary School, Scullen Middle School, and Waubonsie Valley High School.
Ownership History
Date
Name
Owned For
Owner Type
Purchase Details
Closed on
Jun 4, 2003
Sold by
Claybridge Builder Inc
Bought by
Ganga Srinivas and Ganga Roopa
Current Estimated Value
Home Financials for this Owner
Home Financials are based on the most recent Mortgage that was taken out on this home.
Original Mortgage
$500,000
Outstanding Balance
$219,024
Interest Rate
5.78%
Mortgage Type
Purchase Money Mortgage
Estimated Equity
$926,222
Purchase Details
Closed on
Oct 7, 2002
Sold by
Maf Developments Inc
Bought by
Claybridge Builders Inc
Home Financials for this Owner
Home Financials are based on the most recent Mortgage that was taken out on this home.
Original Mortgage
$296,000
Interest Rate
4.75%
Create a Home Valuation Report for This Property
The Home Valuation Report is an in-depth analysis detailing your home's value as well as a comparison with similar homes in the area
Home Values in the Area
Average Home Value in this Area
Purchase History
| Date | Buyer | Sale Price | Title Company |
|---|---|---|---|
| Ganga Srinivas | $702,500 | First American Title | |
| Claybridge Builders Inc | $370,000 | First American Title |
Source: Public Records
Mortgage History
| Date | Status | Borrower | Loan Amount |
|---|---|---|---|
| Open | Ganga Srinivas | $500,000 | |
| Previous Owner | Claybridge Builders Inc | $296,000 |
Source: Public Records
Tax History
| Year | Tax Paid | Tax Assessment Tax Assessment Total Assessment is a certain percentage of the fair market value that is determined by local assessors to be the total taxable value of land and additions on the property. | Land | Improvement |
|---|---|---|---|---|
| 2024 | $19,413 | $304,381 | $66,332 | $238,049 |
| 2023 | $19,413 | $268,888 | $58,597 | $210,291 |
| 2022 | $17,639 | $249,456 | $55,432 | $194,024 |
| 2021 | $16,868 | $237,577 | $52,792 | $184,785 |
| 2020 | $16,551 | $233,813 | $51,956 | $181,857 |
| 2019 | $16,273 | $227,224 | $50,492 | $176,732 |
| 2018 | $16,946 | $232,217 | $49,381 | $182,836 |
| 2017 | $16,693 | $226,222 | $48,106 | $178,116 |
| 2016 | $16,667 | $221,352 | $47,070 | $174,282 |
| 2015 | $16,706 | $212,839 | $45,260 | $167,579 |
| 2014 | $16,706 | $209,089 | $46,190 | $162,899 |
| 2013 | $16,706 | $209,089 | $46,190 | $162,899 |
Source: Public Records
Map
Nearby Homes
- 3432 Redwing Dr Unit 2
- 3021 Saganashkee Ln
- 3807 Landsdown Ave
- 3281 Cool Springs Ct
- 3271 Cool Springs Ct
- 3060 Crystal Rock Rd
- 3847 Gold Cup Ln
- 3816 Grassmere Rd
- 24531 W 103rd St
- 3420 Rosecroft Ln
- 3408 Parliament Ln Unit 1
- 3451 Parliament Ln
- 3339 Rosecroft Ln
- 3740 Idlewild Ln
- 2905 Normandy Cir
- 2344 Corn Lily Rd
- 2904 Portage St
- 3975 Idlewild Ln Unit 107
- 4308 Fraser Cir
- 3559 Scottsdale Cir
- 3612 Hector Ln Unit 6
- 3604 Hector Ln Unit 6
- 3316 Mistflower Ln
- 3312 Mistflower Ln Unit 6
- 3616 Hector Ln
- 3607 Hector Ln
- 3308 Mistflower Ln Unit 6
- 3320 Mistflower Ln
- 3611 Hector Ln Unit 6
- 3603 Hector Ln Unit 6
- 3615 Hector Ln
- 3304 Mistflower Ln Unit 6
- 3620 Hector Ln
- 3415 Kestral Dr
- 3411 Kestral Dr
- 3503 Kestral Dr Unit 6
- 3407 Kestral Dr
- 3708 Nicanoa Ln
- 3712 Nicanoa Ln
- 3619 Hector Ln
Your Personal Tour Guide
Ask me questions while you tour the home.