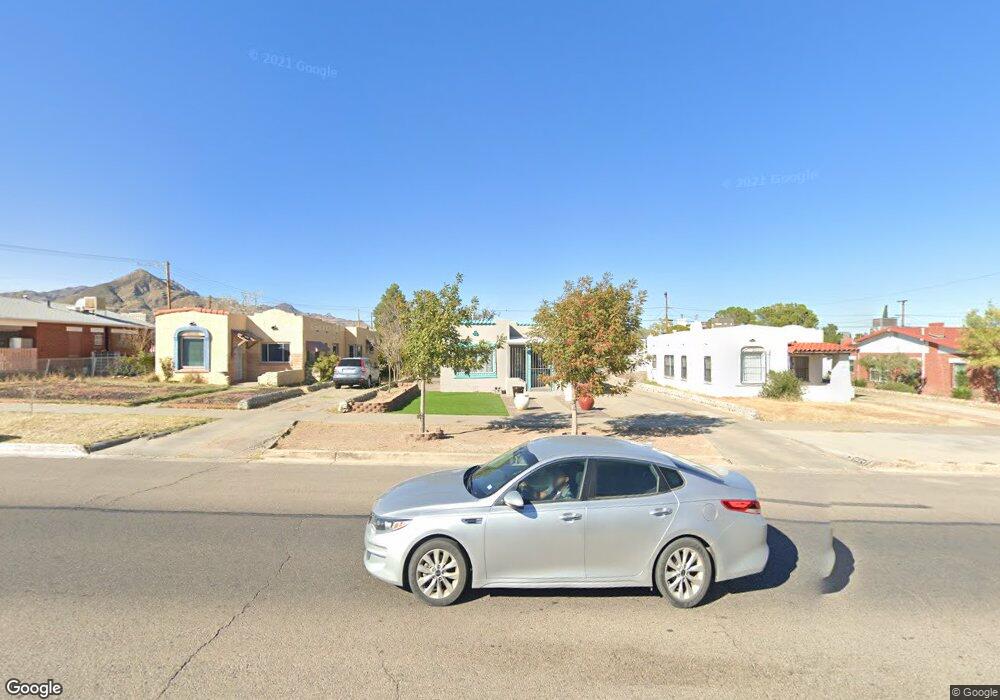
3609 Fort Blvd El Paso, TX 79930
Central NeighborhoodEstimated Value: $146,000 - $191,000
2
Beds
1
Bath
1,034
Sq Ft
$162/Sq Ft
Est. Value
About This Home
This home is located at 3609 Fort Blvd, El Paso, TX 79930 and is currently estimated at $167,632, approximately $162 per square foot. 3609 Fort Blvd is a home located in El Paso County with nearby schools including Rusk Elementary School, Middle School-5 NW Middle, and Austin High School.
Ownership History
Date
Name
Owned For
Owner Type
Purchase Details
Closed on
Apr 28, 2010
Sold by
Uxmal Properties Llc
Bought by
Yanez Getsemani and Ramirez Diana
Current Estimated Value
Home Financials for this Owner
Home Financials are based on the most recent Mortgage that was taken out on this home.
Original Mortgage
$84,500
Outstanding Balance
$56,247
Interest Rate
4.91%
Mortgage Type
Seller Take Back
Estimated Equity
$111,385
Purchase Details
Closed on
Aug 12, 2009
Sold by
Fannie Mae
Bought by
Uxmal Properties Llc
Purchase Details
Closed on
Feb 3, 2009
Sold by
Abraham George David
Bought by
Federal National Mortgage Association
Purchase Details
Closed on
Dec 4, 2006
Sold by
Martin Daugherty Raetta
Bought by
Abraham George David
Home Financials for this Owner
Home Financials are based on the most recent Mortgage that was taken out on this home.
Original Mortgage
$78,500
Interest Rate
6.1%
Mortgage Type
Purchase Money Mortgage
Create a Home Valuation Report for This Property
The Home Valuation Report is an in-depth analysis detailing your home's value as well as a comparison with similar homes in the area
Home Values in the Area
Average Home Value in this Area
Purchase History
| Date | Buyer | Sale Price | Title Company |
|---|---|---|---|
| Yanez Getsemani | -- | None Available | |
| Uxmal Properties Llc | -- | Sierra Title Company Inc | |
| Federal National Mortgage Association | $78,500 | None Available | |
| Abraham George David | -- | None Available |
Source: Public Records
Mortgage History
| Date | Status | Borrower | Loan Amount |
|---|---|---|---|
| Open | Yanez Getsemani | $84,500 | |
| Previous Owner | Abraham George David | $78,500 |
Source: Public Records
Tax History
| Year | Tax Paid | Tax Assessment Tax Assessment Total Assessment is a certain percentage of the fair market value that is determined by local assessors to be the total taxable value of land and additions on the property. | Land | Improvement |
|---|---|---|---|---|
| 2025 | $1,376 | $105,695 | -- | -- |
| 2024 | $1,376 | $94,716 | -- | -- |
| 2023 | $1,376 | $86,105 | $0 | $0 |
| 2022 | $2,317 | $78,277 | $15,180 | $63,097 |
| 2021 | $2,553 | $78,277 | $15,180 | $63,097 |
| 2020 | $2,285 | $74,335 | $13,860 | $60,475 |
| 2018 | $2,069 | $69,911 | $13,860 | $56,051 |
| 2017 | $1,843 | $65,421 | $13,860 | $51,561 |
| 2016 | $2,010 | $71,348 | $13,860 | $57,488 |
| 2015 | $1,800 | $71,348 | $13,860 | $57,488 |
| 2014 | $1,800 | $74,650 | $13,860 | $60,790 |
Source: Public Records
Map
Nearby Homes
- 3510 Porter Ave
- 3425 Morehead Ave
- 3704 Mckinley Ave
- 3500 Mckinley Ave
- 3901 Porter Ave
- 3312 Justus St
- 3915 Idalia Ave
- 3901 Mckinley Ave
- 3915 Mobile Ave Unit 1-3
- 3307 Jackson Ave
- 2709 N Copia St
- 3125 Hamilton Ave Unit A&B
- 3413 Monroe Ave
- 3215 Mobile Ave
- 3905 Monroe Ave
- 3926 Nashville Ave
- 3817 Frankfort Ave
- 3831 Frankfort Ave
- 2518 Partello St
- 3329 Harrison Ave
- 3615 Fort Blvd
- 3605 Fort Blvd
- 3617 Fort Blvd
- 3601 Fort Blvd
- 3612 Morehead Ave
- 3621 Fort Blvd
- 3616 Morehead Ave
- 3600 Morehead Ave
- 3625 Fort Blvd
- 3622 Morehead Ave
- 3604 Fort Blvd
- 3610 Fort Blvd
- 3531 Fort Blvd
- 3626 Morehead Ave
- 3629 Fort Blvd
- 3618 Fort Blvd
- 3600 Fort Blvd
- 3522 Morehead Ave
- 3622 Fort Blvd
- 3630 Morehead Ave
Your Personal Tour Guide
Ask me questions while you tour the home.