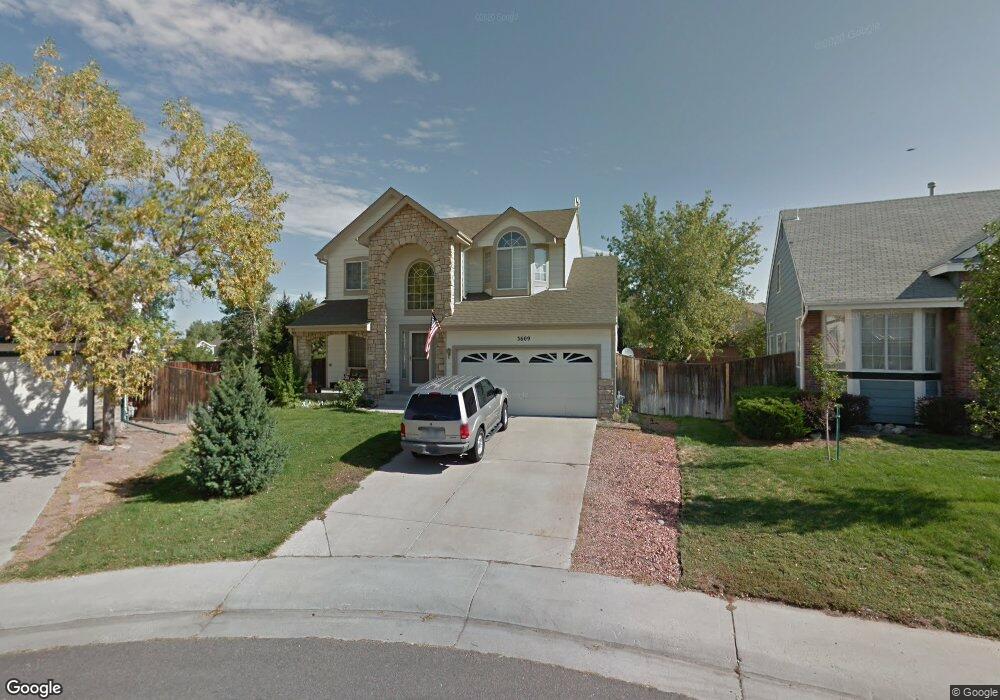
3609 Rosewalk Cir Highlands Ranch, CO 80129
Westridge NeighborhoodEstimated Value: $595,000 - $653,000
3
Beds
4
Baths
1,936
Sq Ft
$320/Sq Ft
Est. Value
About This Home
This home is located at 3609 Rosewalk Cir, Highlands Ranch, CO 80129 and is currently estimated at $620,323, approximately $320 per square foot. 3609 Rosewalk Cir is a home located in Douglas County with nearby schools including Coyote Creek Elementary School, Ranch View Middle School, and Thunderridge High School.
Ownership History
Date
Name
Owned For
Owner Type
Purchase Details
Closed on
Nov 16, 2015
Sold by
Worrell M Kathy
Bought by
Worrell Jones M Kathy
Current Estimated Value
Home Financials for this Owner
Home Financials are based on the most recent Mortgage that was taken out on this home.
Original Mortgage
$180,500
Outstanding Balance
$74,070
Interest Rate
3.81%
Mortgage Type
New Conventional
Estimated Equity
$546,253
Purchase Details
Closed on
Jul 28, 1995
Sold by
Mastriano Wayne T and Mastriano Rosalila Jaramillo
Bought by
Worrell M Kathy
Home Financials for this Owner
Home Financials are based on the most recent Mortgage that was taken out on this home.
Original Mortgage
$75,000
Interest Rate
6.95%
Purchase Details
Closed on
Apr 25, 1990
Sold by
Centex Real Estate Corp
Bought by
Mastriano Wayne T and Mastriano Rosalila Jaramillo
Purchase Details
Closed on
Nov 7, 1989
Sold by
Mission Viejo Co
Bought by
Centex Real Estate Corp
Purchase Details
Closed on
Sep 28, 1989
Sold by
Mission Viejo Co
Bought by
Centex Real Estate Corp
Create a Home Valuation Report for This Property
The Home Valuation Report is an in-depth analysis detailing your home's value as well as a comparison with similar homes in the area
Home Values in the Area
Average Home Value in this Area
Purchase History
| Date | Buyer | Sale Price | Title Company |
|---|---|---|---|
| Worrell Jones M Kathy | -- | None Available | |
| Worrell M Kathy | $145,000 | Land Title | |
| Mastriano Wayne T | $117,300 | -- | |
| Centex Real Estate Corp | -- | -- | |
| Centex Real Estate Corp | $164,600 | -- |
Source: Public Records
Mortgage History
| Date | Status | Borrower | Loan Amount |
|---|---|---|---|
| Open | Worrell Jones M Kathy | $180,500 | |
| Previous Owner | Worrell M Kathy | $75,000 |
Source: Public Records
Tax History Compared to Growth
Tax History
| Year | Tax Paid | Tax Assessment Tax Assessment Total Assessment is a certain percentage of the fair market value that is determined by local assessors to be the total taxable value of land and additions on the property. | Land | Improvement |
|---|---|---|---|---|
| 2024 | $3,098 | $43,260 | $9,420 | $33,840 |
| 2023 | $3,092 | $43,260 | $9,420 | $33,840 |
| 2022 | $2,760 | $30,210 | $6,420 | $23,790 |
| 2021 | $2,871 | $30,210 | $6,420 | $23,790 |
| 2020 | $2,587 | $27,890 | $4,360 | $23,530 |
| 2019 | $2,596 | $27,890 | $4,360 | $23,530 |
| 2018 | $2,358 | $24,950 | $4,760 | $20,190 |
| 2017 | $2,147 | $24,950 | $4,760 | $20,190 |
| 2016 | $2,013 | $22,960 | $4,570 | $18,390 |
| 2015 | $2,056 | $22,960 | $4,570 | $18,390 |
| 2014 | $1,907 | $19,660 | $3,630 | $16,030 |
Source: Public Records
Map
Nearby Homes
- 3644 Rosewalk Cir
- 3641 Rosewalk Cir
- 9821 Rock Dove Ln
- 9711 Bucknell Way
- 10054 Deer Creek St
- 9755 Spring Hill St
- 9488 S Hackberry Ln
- 9477 S Hackberry Ln
- 9409 S Hackberry Ln
- 2841 High Cliffe Place
- 10347 Woodrose Ln
- 1993 Mountain Maple Ave
- 10505 Hyacinth Place
- 2627 Baneberry Ln
- 9227 Gold Lace Place
- 9178 Gold Lace Place
- 1864 Mountain Maple Ave
- 2174 Cactus Bluff Ave
- 10672 Hyacinth St
- 2590 W Bitterroot Place
- 3611 Rosewalk Cir
- 3607 Rosewalk Cir
- 3613 Rosewalk Cir
- 3605 Rosewalk Cir
- 9802 Rosewalk Dr
- 9804 Rosewalk Dr
- 3612 Rosewalk Cir
- 3615 Rosewalk Cir
- 3603 Rosewalk Cir
- 9806 Rosewalk Dr
- 9847 Bucknell Ct
- 3614 Rosewalk Cir
- 9808 Rosewalk Dr
- 3617 Rosewalk Cir
- 3648 Rosewalk Cir
- 3601 Rosewalk Cir
- 9846 Bucknell Ct
- 9839 Bucknell Ct
- 3616 Rosewalk Cir
- 3616 W Rosewalk Cir