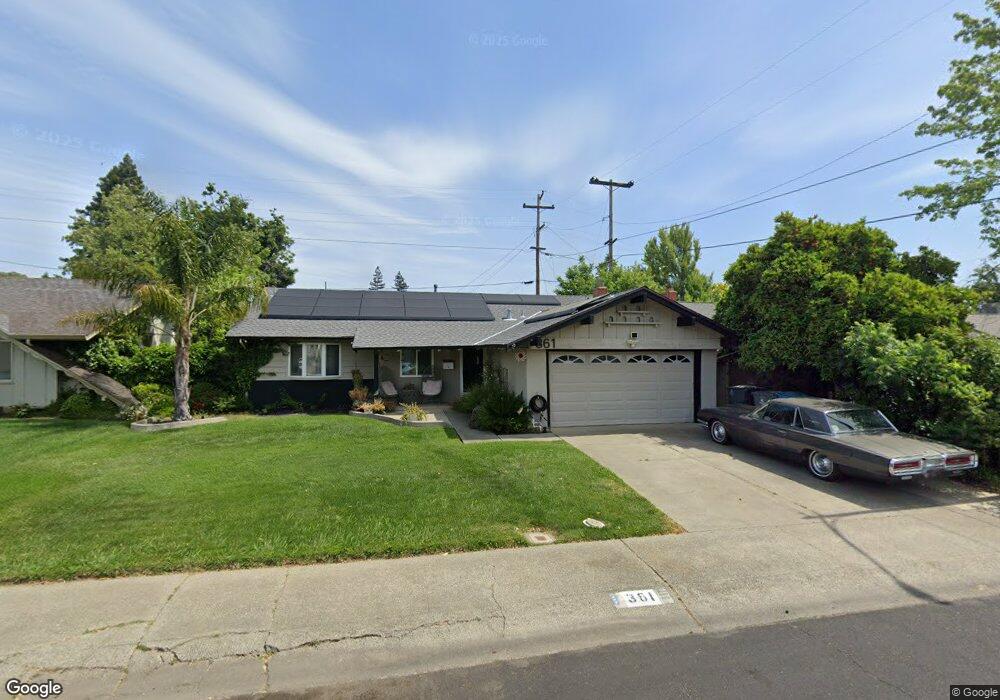
361 Azalea Way Vacaville, CA 95688
Estimated Value: $547,000 - $572,000
3
Beds
2
Baths
1,329
Sq Ft
$423/Sq Ft
Est. Value
About This Home
This home is located at 361 Azalea Way, Vacaville, CA 95688 and is currently estimated at $561,994, approximately $422 per square foot. 361 Azalea Way is a home located in Solano County with nearby schools including Alamo Elementary School, Orchard Elementary School, and Willis Jepson Middle School.
Ownership History
Date
Name
Owned For
Owner Type
Purchase Details
Closed on
Oct 17, 2016
Sold by
Comack Kari R
Bought by
Ferron Britney A
Current Estimated Value
Home Financials for this Owner
Home Financials are based on the most recent Mortgage that was taken out on this home.
Original Mortgage
$405,519
Outstanding Balance
$328,055
Interest Rate
3.75%
Mortgage Type
FHA
Estimated Equity
$233,939
Purchase Details
Closed on
Apr 12, 2016
Sold by
Paolini Suzan L
Bought by
Comack Kari R
Home Financials for this Owner
Home Financials are based on the most recent Mortgage that was taken out on this home.
Original Mortgage
$283,500
Interest Rate
3.64%
Mortgage Type
New Conventional
Purchase Details
Closed on
Oct 7, 2004
Sold by
French Florence J
Bought by
The Florence J French Living Trust and French Florence J
Create a Home Valuation Report for This Property
The Home Valuation Report is an in-depth analysis detailing your home's value as well as a comparison with similar homes in the area
Home Values in the Area
Average Home Value in this Area
Purchase History
| Date | Buyer | Sale Price | Title Company |
|---|---|---|---|
| Ferron Britney A | $413,000 | Placer Title Company | |
| Comack Kari R | $315,000 | Fidelity National Title Co | |
| The Florence J French Living Trust | -- | -- |
Source: Public Records
Mortgage History
| Date | Status | Borrower | Loan Amount |
|---|---|---|---|
| Open | Ferron Britney A | $405,519 | |
| Previous Owner | Comack Kari R | $283,500 |
Source: Public Records
Tax History Compared to Growth
Tax History
| Year | Tax Paid | Tax Assessment Tax Assessment Total Assessment is a certain percentage of the fair market value that is determined by local assessors to be the total taxable value of land and additions on the property. | Land | Improvement |
|---|---|---|---|---|
| 2025 | $5,430 | $479,316 | $81,238 | $398,078 |
| 2024 | $5,430 | $469,919 | $79,646 | $390,273 |
| 2023 | $5,300 | $460,706 | $78,085 | $382,621 |
| 2022 | $5,161 | $451,673 | $76,554 | $375,119 |
| 2021 | $5,169 | $442,817 | $75,053 | $367,764 |
| 2020 | $5,100 | $438,278 | $74,284 | $363,994 |
| 2019 | $5,010 | $429,685 | $72,828 | $356,857 |
| 2018 | $4,953 | $421,260 | $71,400 | $349,860 |
| 2017 | $4,787 | $413,000 | $70,000 | $343,000 |
| 2016 | $871 | $72,795 | $12,398 | $60,397 |
| 2015 | $776 | $71,702 | $12,212 | $59,490 |
| 2014 | $726 | $70,298 | $11,973 | $58,325 |
Source: Public Records
Map
Nearby Homes
- 491 Buck Ave
- 571 Nottingham Dr
- 680 S Orchard Ave
- 721 Camellia Way
- 569 Alamo Dr
- 365 Acacia St
- 253 W Kendal St
- 818 Lovers Ln
- 507 Buckeye St
- 970 El Camino Ave Unit 3
- 100 Ramona St
- 434 Cottonwood St
- 332 Cottonwood St
- 0 Merchant St Unit 325089259
- 149 Mason St
- 101 Main St
- 149 Fairoaks Dr
- 206 Arbor St
- 124 Main St
- 206 Madrone St
- 355 Azalea Way
- 367 Azalea Way
- 360 Camellia Way
- 370 Camellia Way
- 349 Azalea Way
- 373 Azalea Way
- 350 Camellia Way
- 376 Camellia Way
- 360 Azalea Way
- 350 Azalea Way
- 370 Azalea Way
- 385 Azalea Way
- 384 Camellia Way
- 340 Camellia Way
- 343 Azalea Way
- 340 Azalea Way
- 380 Azalea Way
- 392 Camellia Way
- 330 Azalea Way
- 390 Azalea Way