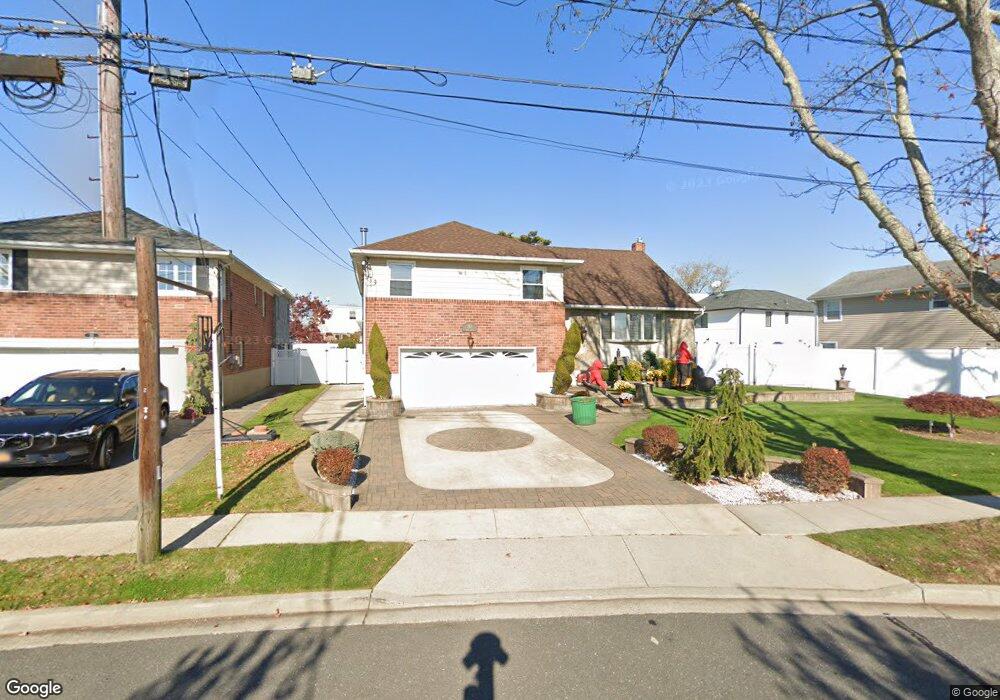
361 Divot Rd Oceanside, NY 11572
Estimated Value: $986,708 - $1,021,000
Studio
4
Baths
2,174
Sq Ft
$462/Sq Ft
Est. Value
About This Home
This home is located at 361 Divot Rd, Oceanside, NY 11572 and is currently estimated at $1,003,854, approximately $461 per square foot. 361 Divot Rd is a home located in Nassau County with nearby schools including Boardman Elementary School, Oceanside Middle School, and Oceanside High School.
Ownership History
Date
Name
Owned For
Owner Type
Purchase Details
Closed on
Sep 16, 2010
Sold by
Fiorito Ciro and Fiorito Joanne
Bought by
Colley Brendan and Bartolomeo-Colley Maryann D
Current Estimated Value
Home Financials for this Owner
Home Financials are based on the most recent Mortgage that was taken out on this home.
Original Mortgage
$170,000
Outstanding Balance
$112,484
Interest Rate
4.48%
Mortgage Type
Purchase Money Mortgage
Estimated Equity
$891,370
Purchase Details
Closed on
Mar 14, 2008
Sold by
Stein Seymour
Bought by
Fiorito Ciro
Create a Home Valuation Report for This Property
The Home Valuation Report is an in-depth analysis detailing your home's value as well as a comparison with similar homes in the area
Home Values in the Area
Average Home Value in this Area
Purchase History
| Date | Buyer | Sale Price | Title Company |
|---|---|---|---|
| Colley Brendan | $735,000 | -- | |
| Fiorito Ciro | $635,000 | -- |
Source: Public Records
Mortgage History
| Date | Status | Borrower | Loan Amount |
|---|---|---|---|
| Open | Colley Brendan | $170,000 |
Source: Public Records
Tax History
| Year | Tax Paid | Tax Assessment Tax Assessment Total Assessment is a certain percentage of the fair market value that is determined by local assessors to be the total taxable value of land and additions on the property. | Land | Improvement |
|---|---|---|---|---|
| 2025 | $16,568 | $600 | $258 | $342 |
| 2024 | $4,964 | $625 | $269 | $356 |
Source: Public Records
Map
Nearby Homes
- 348 Links Dr E
- 512 Links Dr E
- 487 Links Dr E
- 405 Club Ct
- 3461 Ocean Ave
- 3452 Ocean Ave
- 3391 Fairway Rd
- 163 Mott St
- 3309 Skillman Ave
- 3432 Bayfield Blvd
- 3522 Frederick St
- 3354 Knight St
- 3451 3rd St
- 3483 Frederick St
- 295 Thorn St
- 30 Gifford Ave
- 3354 2nd St
- 3186 Grand Ave
- 3195 Nantucket Ln
- 739 Bonnie Dr
Your Personal Tour Guide
Ask me questions while you tour the home.