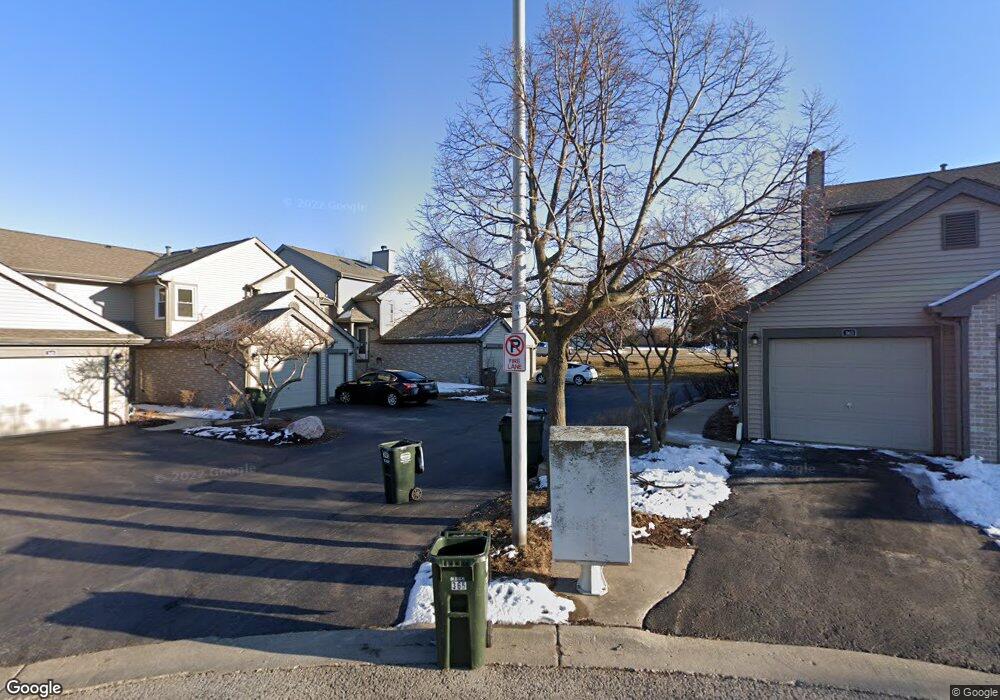
361 Grissom Ct Unit 5SA7 Hoffman Estates, IL 60169
South Hoffman Estates NeighborhoodEstimated Value: $226,000 - $279,000
2
Beds
2
Baths
1,225
Sq Ft
$207/Sq Ft
Est. Value
About This Home
This home is located at 361 Grissom Ct Unit 5SA7, Hoffman Estates, IL 60169 and is currently estimated at $253,895, approximately $207 per square foot. 361 Grissom Ct Unit 5SA7 is a home located in Cook County with nearby schools including Lakeview Elementary School, Helen Keller Junior High School, and J B Conant High School.
Ownership History
Date
Name
Owned For
Owner Type
Purchase Details
Closed on
Jul 31, 2017
Sold by
Tomar Shailsh and Tomar Linh
Bought by
Dhiman Ashok K and Soni Shalini
Current Estimated Value
Home Financials for this Owner
Home Financials are based on the most recent Mortgage that was taken out on this home.
Original Mortgage
$126,000
Outstanding Balance
$64,335
Interest Rate
3.87%
Mortgage Type
New Conventional
Estimated Equity
$189,560
Purchase Details
Closed on
Mar 18, 2014
Sold by
Tcf National Bank
Bought by
Tomar Shailesh
Purchase Details
Closed on
Dec 20, 2002
Sold by
Tierney Randy M
Bought by
Joshi Devendra and Joshi Pramila
Home Financials for this Owner
Home Financials are based on the most recent Mortgage that was taken out on this home.
Original Mortgage
$143,560
Interest Rate
6.13%
Create a Home Valuation Report for This Property
The Home Valuation Report is an in-depth analysis detailing your home's value as well as a comparison with similar homes in the area
Home Values in the Area
Average Home Value in this Area
Purchase History
| Date | Buyer | Sale Price | Title Company |
|---|---|---|---|
| Dhiman Ashok K | $168,000 | Old Republic Title | |
| Tomar Shailesh | $117,000 | Atgf Inc | |
| Tcf National Bank | -- | Attorneys Title Guaranty Fun | |
| Joshi Devendra | -- | First American Title |
Source: Public Records
Mortgage History
| Date | Status | Borrower | Loan Amount |
|---|---|---|---|
| Open | Dhiman Ashok K | $126,000 | |
| Previous Owner | Joshi Devendra | $143,560 |
Source: Public Records
Tax History
| Year | Tax Paid | Tax Assessment Tax Assessment Total Assessment is a certain percentage of the fair market value that is determined by local assessors to be the total taxable value of land and additions on the property. | Land | Improvement |
|---|---|---|---|---|
| 2025 | $4,487 | $20,198 | $2,645 | $17,553 |
| 2024 | $4,487 | $14,621 | $2,204 | $12,417 |
| 2023 | $4,342 | $14,621 | $2,204 | $12,417 |
| 2022 | $4,342 | $14,621 | $2,204 | $12,417 |
| 2021 | $3,848 | $11,485 | $2,644 | $8,841 |
| 2020 | $3,758 | $11,485 | $2,644 | $8,841 |
| 2019 | $3,790 | $12,944 | $2,644 | $10,300 |
| 2018 | $3,370 | $10,334 | $2,203 | $8,131 |
| 2017 | $2,229 | $10,334 | $2,203 | $8,131 |
| 2016 | $2,335 | $10,334 | $2,203 | $8,131 |
| 2015 | $2,813 | $8,759 | $1,928 | $6,831 |
| 2014 | $1,953 | $8,759 | $1,928 | $6,831 |
| 2013 | $1,884 | $8,759 | $1,928 | $6,831 |
Source: Public Records
Map
Nearby Homes
- 860 Olive St
- 368 Willow Tree Ct
- 625 Morton St
- 630 Bode Rd
- 100 Des Plaines Ln
- 600 Mesa Dr Unit 104
- 600 Mesa Dr Unit 103
- 670 Lakeview Ln
- 480 Illinois Blvd
- 555 Heritage Dr Unit 315
- 1180 Meadow Ln Unit 6306
- 1025 Higgins Quarters Dr Unit 4-109
- 200 W Thacker St
- 720 Hill Dr Unit 8303
- 1085 Higgins Quarters Dr Unit 104
- 730 Hill Dr Unit 9205
- 75 Carthage Ln
- 313 Lincoln St
- 540 Newark Ln
- 395 Washington Blvd
- 361 Grissom Ct Unit 1
- 357 Grissom Ct Unit 5SB8
- 353 Grissom Ct Unit 5SE6
- 349 Grissom Ct Unit 5SD5
- 365 Grissom Ct Unit 4SA1
- 365 Grissom Ct Unit 365
- 345 Grissom Ct Unit 5SC4
- 341 Grissom Ct Unit 5SD3
- 373 Grissom Ct Unit 4SE3
- 337 Grissom Ct Unit 5SB2
- 333 Grissom Ct Unit 5SA1
- 377 Grissom Ct Unit 4SD4
- 381 Grissom Ct Unit 4SC5
- 392 Grissom Ct Unit 3SA1
- 385 Grissom Ct Unit 4SE6
- 325 Grissom Ct Unit 6SB8
- 388 Grissom Ct Unit 3SB2
- 389 Grissom Ct Unit 4SB8L
- 389 Grissom Ct Unit 4SBBL
- 329 Grissom Ct Unit 6SA7
Your Personal Tour Guide
Ask me questions while you tour the home.