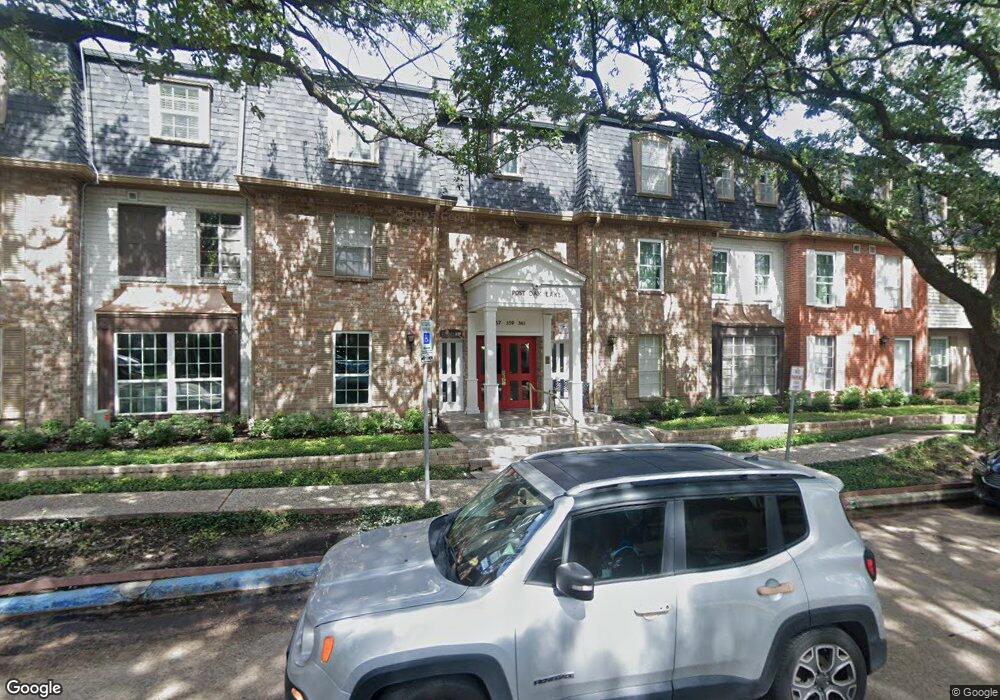
361 N Post Oak Ln Unit 330 Houston, TX 77024
Uptown-Galleria District NeighborhoodEstimated Value: $144,452 - $181,000
1
Bed
1
Bath
894
Sq Ft
$176/Sq Ft
Est. Value
About This Home
This home is located at 361 N Post Oak Ln Unit 330, Houston, TX 77024 and is currently estimated at $157,113, approximately $175 per square foot. 361 N Post Oak Ln Unit 330 is a home located in Harris County with nearby schools including Hunters Creek Elementary School, Spring Branch Middle School, and Memorial High School.
Ownership History
Date
Name
Owned For
Owner Type
Purchase Details
Closed on
Oct 2, 2019
Sold by
Allstun Michelle and Allstun Lance
Bought by
Thompson Scott Matthew
Current Estimated Value
Home Financials for this Owner
Home Financials are based on the most recent Mortgage that was taken out on this home.
Original Mortgage
$93,650
Outstanding Balance
$82,042
Interest Rate
3.5%
Mortgage Type
New Conventional
Estimated Equity
$75,071
Purchase Details
Closed on
Dec 17, 2010
Sold by
Richards Leonard and White Nancy
Bought by
Minton Michelle F
Home Financials for this Owner
Home Financials are based on the most recent Mortgage that was taken out on this home.
Original Mortgage
$90,154
Interest Rate
4.4%
Mortgage Type
FHA
Purchase Details
Closed on
Dec 27, 2007
Sold by
White Nancy
Bought by
Richards Leonard
Purchase Details
Closed on
Nov 24, 2007
Sold by
Whitten Vivian and White Nancy
Bought by
White Nancy
Create a Home Valuation Report for This Property
The Home Valuation Report is an in-depth analysis detailing your home's value as well as a comparison with similar homes in the area
Home Values in the Area
Average Home Value in this Area
Purchase History
| Date | Buyer | Sale Price | Title Company |
|---|---|---|---|
| Thompson Scott Matthew | -- | Old Republic Natl Ttl Ins Co | |
| Minton Michelle F | -- | Alamo Title Company | |
| Richards Leonard | -- | Greater Texas Title Company | |
| White Nancy | -- | None Available |
Source: Public Records
Mortgage History
| Date | Status | Borrower | Loan Amount |
|---|---|---|---|
| Open | Thompson Scott Matthew | $93,650 | |
| Previous Owner | Minton Michelle F | $90,154 |
Source: Public Records
Tax History Compared to Growth
Tax History
| Year | Tax Paid | Tax Assessment Tax Assessment Total Assessment is a certain percentage of the fair market value that is determined by local assessors to be the total taxable value of land and additions on the property. | Land | Improvement |
|---|---|---|---|---|
| 2025 | $3,311 | $164,346 | $31,226 | $133,120 |
| 2024 | $3,311 | $150,197 | $28,537 | $121,660 |
| 2023 | $3,311 | $144,160 | $27,390 | $116,770 |
| 2022 | $1,417 | $132,565 | $25,187 | $107,378 |
| 2021 | $3,207 | $129,680 | $24,639 | $105,041 |
| 2020 | $3,249 | $129,680 | $24,639 | $105,041 |
| 2019 | $3,395 | $129,680 | $24,639 | $105,041 |
| 2018 | $1,269 | $129,680 | $24,639 | $105,041 |
| 2017 | $3,390 | $129,680 | $24,639 | $105,041 |
| 2016 | $3,393 | $129,680 | $24,639 | $105,041 |
| 2015 | $2,715 | $128,651 | $24,444 | $104,207 |
| 2014 | $2,715 | $102,000 | $20,405 | $81,595 |
Source: Public Records
Map
Nearby Homes
- 357 N Post Oak Ln Unit 102
- 357 N Post Oak Ln Unit 312
- 357 N Post Oak Ln Unit 117
- 359 N Post Oak Ln Unit 221
- 361 N Post Oak Ln Unit 239
- 361 N Post Oak Ln Unit 341
- 361 N Post Oak Ln Unit 231
- 361 N Post Oak Ln Unit 131
- 361 N Post Oak Ln Unit 331
- 351 N Post Oak Ln Unit 610
- 353 N Post Oak Ln Unit 621
- 353 N Post Oak Ln Unit 627
- 353 N Post Oak Ln Unit 819
- 470 N Post Oak Ln Unit 470
- 484 N Post Oak Ln Unit 484
- 454 N Post Oak Ln
- 406 N Post Oak Ln
- 491 N Post Oak Ln Unit 491
- 473 N Post Oak Ln Unit 473
- 8626 La Fonte St
- 361 N Post Oak Ln Unit 335
- 361 N Post Oak Ln Unit 136
- 361 N Post Oak Ln Unit 130
- 361 N Post Oak Ln Unit 233
- 361 N Post Oak Ln Unit 338
- 361 N Post Oak Ln Unit 139
- 361 N Post Oak Ln Unit 343
- 361 N Post Oak Ln Unit 237
- 361 N Post Oak Ln Unit 244
- 361 N Post Oak Ln Unit 133
- 361 N Post Oak Ln Unit 346
- 361 N Post Oak Ln Unit 344
- 361 N Post Oak Ln Unit 342
- 361 N Post Oak Ln Unit 340
- 361 N Post Oak Ln Unit 337
- 361 N Post Oak Ln Unit 336
- 361 N Post Oak Ln Unit 334
- 361 N Post Oak Ln Unit 333
- 361 N Post Oak Ln Unit 332
- 361 N Post Oak Ln Unit 246