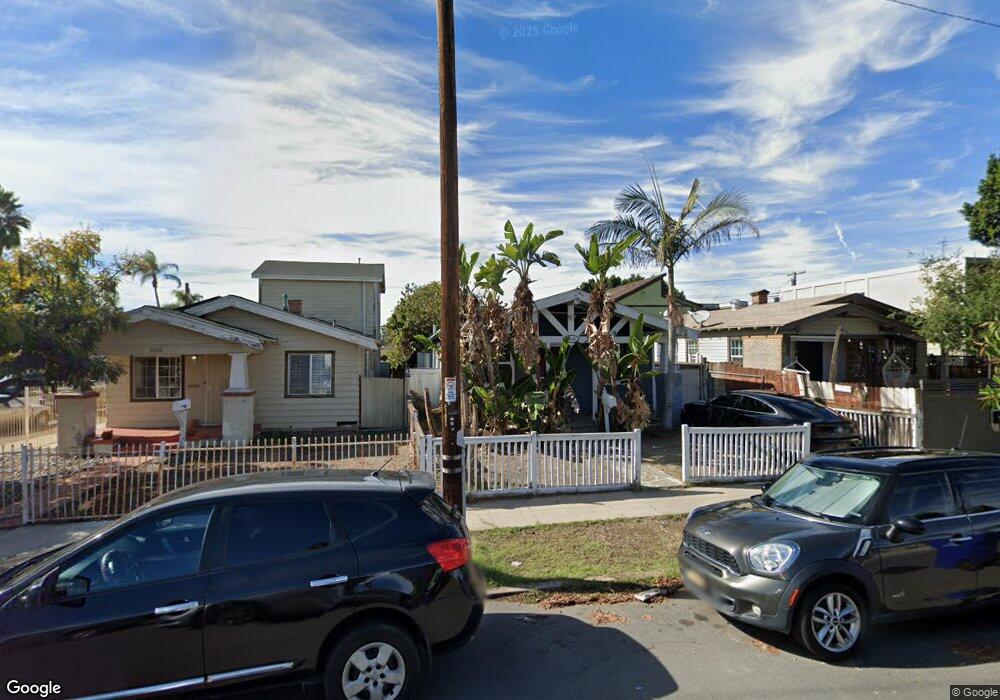
3610 Highland Ave San Diego, CA 92105
Fairmount Village NeighborhoodEstimated Value: $559,000 - $852,000
2
Beds
2
Baths
848
Sq Ft
$801/Sq Ft
Est. Value
About This Home
This home is located at 3610 Highland Ave, San Diego, CA 92105 and is currently estimated at $679,424, approximately $801 per square foot. 3610 Highland Ave is a home located in San Diego County with nearby schools including Rosa Parks Elementary School, Clark Middle School, and Herbert Hoover High School.
Ownership History
Date
Name
Owned For
Owner Type
Purchase Details
Closed on
Feb 17, 2010
Sold by
Alonge Jeffrey M and Alonge Katie B
Bought by
Lin John Chia Hung and Maxwell Tiffani
Current Estimated Value
Home Financials for this Owner
Home Financials are based on the most recent Mortgage that was taken out on this home.
Original Mortgage
$231,200
Outstanding Balance
$152,325
Interest Rate
4.94%
Mortgage Type
New Conventional
Estimated Equity
$527,099
Purchase Details
Closed on
Oct 22, 2004
Sold by
Tincher Timothy W and Tincher Liliana G
Bought by
Alonge Jeffrey M and Carmody Katie B
Home Financials for this Owner
Home Financials are based on the most recent Mortgage that was taken out on this home.
Original Mortgage
$264,060
Interest Rate
5.7%
Mortgage Type
Unknown
Purchase Details
Closed on
Jan 27, 1992
Purchase Details
Closed on
Aug 16, 1988
Create a Home Valuation Report for This Property
The Home Valuation Report is an in-depth analysis detailing your home's value as well as a comparison with similar homes in the area
Home Values in the Area
Average Home Value in this Area
Purchase History
| Date | Buyer | Sale Price | Title Company |
|---|---|---|---|
| Lin John Chia Hung | $289,000 | Ticor Title | |
| Alonge Jeffrey M | $298,000 | Fidelity National Title | |
| -- | $86,000 | -- | |
| -- | $76,100 | -- |
Source: Public Records
Mortgage History
| Date | Status | Borrower | Loan Amount |
|---|---|---|---|
| Open | Lin John Chia Hung | $231,200 | |
| Previous Owner | Alonge Jeffrey M | $264,060 | |
| Closed | Alonge Jeffrey M | $25,000 |
Source: Public Records
Tax History Compared to Growth
Tax History
| Year | Tax Paid | Tax Assessment Tax Assessment Total Assessment is a certain percentage of the fair market value that is determined by local assessors to be the total taxable value of land and additions on the property. | Land | Improvement |
|---|---|---|---|---|
| 2025 | $4,526 | $373,033 | $170,381 | $202,652 |
| 2024 | $4,526 | $365,720 | $167,041 | $198,679 |
| 2023 | $4,426 | $358,550 | $163,766 | $194,784 |
| 2022 | $4,309 | $351,520 | $160,555 | $190,965 |
| 2021 | $4,279 | $344,628 | $157,407 | $187,221 |
| 2020 | $4,228 | $341,095 | $155,793 | $185,302 |
| 2019 | $4,153 | $334,408 | $152,739 | $181,669 |
| 2018 | $3,883 | $327,852 | $149,745 | $178,107 |
| 2017 | $82 | $321,424 | $146,809 | $174,615 |
| 2016 | $3,730 | $315,123 | $143,931 | $171,192 |
| 2015 | $3,593 | $310,391 | $141,770 | $168,621 |
| 2014 | $3,536 | $304,311 | $138,993 | $165,318 |
Source: Public Records
Map
Nearby Homes
- 3655 44th St
- 3571 Highland Ave
- 3565 Highland Ave Unit 5
- 3578 Chamoune Ave
- 3733 Chamoune Ave
- 4600 Myrtle Ave
- 3215 44th St Unit 17
- 3863 Highland Ave Unit 4
- 3825 Van Dyke Ave
- 3450 42nd St
- 3842 46th St
- 3518-3520 Euclid Ave E
- 3815 42nd St
- 3833-39 N 42nd St
- 0 42nd Unit PTP2505266
- 3222 42nd St
- 3124 Menlo Ave
- 4837 Castle Ave
- 4025 Van Dyke Ave
- 0 Highland Ave Unit PTP2503410
- 3602 Highland Ave
- 3614 Highland Ave
- 4426 Dwight St
- 3622 Highland Ave
- 3626 Highland Ave Unit 32
- 3609 Highland Ave Unit 11
- 3617 Highland Ave
- 3592 Highland Ave
- 4437 Dwight St
- 3605 44th St
- 3634 Highland Ave
- 4427 Dwight St
- 3619 44th St Unit 21
- 3638 Highland Ave
- 3611 44th St
- 3621 Highland Ave
- 3627 44th St
- 3584 Highland Ave
- 4468 Dwight St Unit 12
- 3642 Highland Ave