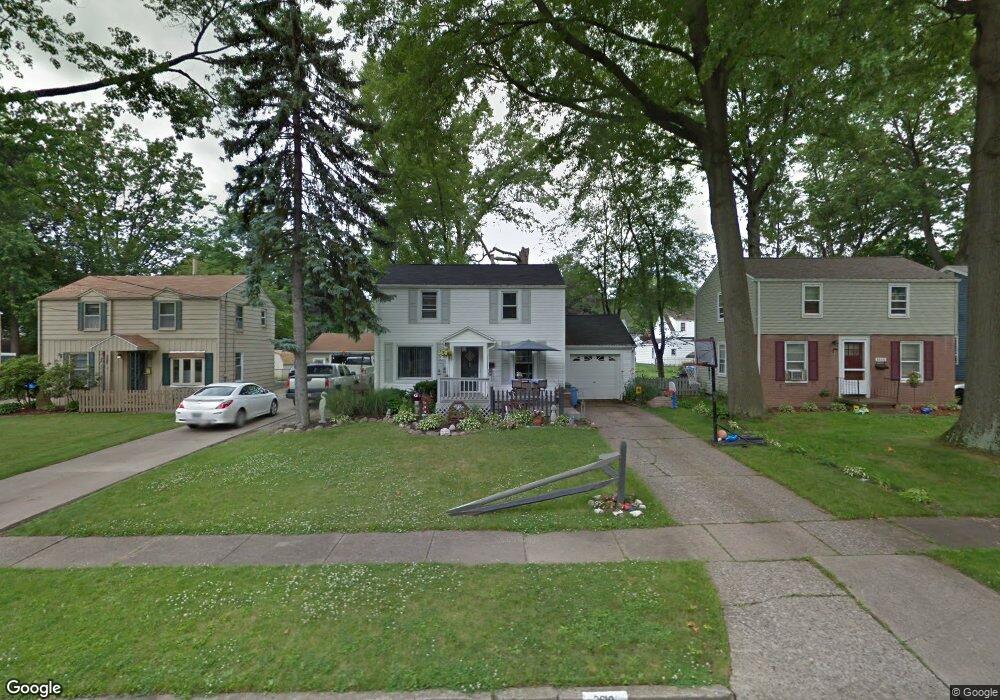
3610 Shelby Rd Youngstown, OH 44511
Kirkmere NeighborhoodEstimated Value: $101,000 - $178,000
2
Beds
1
Bath
936
Sq Ft
$136/Sq Ft
Est. Value
About This Home
This home is located at 3610 Shelby Rd, Youngstown, OH 44511 and is currently estimated at $127,333, approximately $136 per square foot. 3610 Shelby Rd is a home located in Mahoning County with nearby schools including Kirkmere Elementary School, Chaney High School, and Horizon Science Academy - Youngstown.
Ownership History
Date
Name
Owned For
Owner Type
Purchase Details
Closed on
Jan 14, 2020
Sold by
Mahoning County Land Reutilization Corp
Bought by
Tierney Jennifer Marie
Current Estimated Value
Purchase Details
Closed on
Aug 1, 2018
Sold by
Federal National Mortgage Association
Bought by
Youngstown Neighborhood Development Corp
Purchase Details
Closed on
Jul 23, 2018
Sold by
Jones Jennifer A
Bought by
Federal National Mortgage Association
Purchase Details
Closed on
Jan 22, 2001
Sold by
Thomas Frank D
Bought by
Jones Jennifer A
Home Financials for this Owner
Home Financials are based on the most recent Mortgage that was taken out on this home.
Original Mortgage
$45,000
Interest Rate
7.43%
Purchase Details
Closed on
Nov 30, 1995
Sold by
Marie C Lesko Est
Bought by
Thomas Frank D
Purchase Details
Closed on
Mar 28, 1991
Bought by
Lesko Marie
Create a Home Valuation Report for This Property
The Home Valuation Report is an in-depth analysis detailing your home's value as well as a comparison with similar homes in the area
Home Values in the Area
Average Home Value in this Area
Purchase History
| Date | Buyer | Sale Price | Title Company |
|---|---|---|---|
| Tierney Jennifer Marie | -- | None Available | |
| Youngstown Neighborhood Development Corp | -- | None Available | |
| Federal National Mortgage Association | $36,000 | None Available | |
| Jones Jennifer A | -- | -- | |
| Thomas Frank D | $35,000 | -- | |
| Lesko Marie | -- | -- |
Source: Public Records
Mortgage History
| Date | Status | Borrower | Loan Amount |
|---|---|---|---|
| Previous Owner | Jones Jennifer A | $45,000 |
Source: Public Records
Tax History Compared to Growth
Tax History
| Year | Tax Paid | Tax Assessment Tax Assessment Total Assessment is a certain percentage of the fair market value that is determined by local assessors to be the total taxable value of land and additions on the property. | Land | Improvement |
|---|---|---|---|---|
| 2024 | $79 | $1,620 | $1,620 | -- |
| 2023 | $78 | $1,620 | $1,620 | $0 |
| 2022 | $44 | $700 | $700 | $0 |
| 2021 | $44 | $700 | $700 | $0 |
| 2020 | $0 | $700 | $700 | $0 |
| 2019 | $39 | $560 | $560 | $0 |
| 2018 | $982 | $14,110 | $1,860 | $12,250 |
| 2017 | $1,072 | $14,110 | $1,860 | $12,250 |
| 2016 | $1,164 | $18,060 | $2,230 | $15,830 |
| 2015 | $1,140 | $18,060 | $2,230 | $15,830 |
| 2014 | $1,132 | $18,060 | $2,230 | $15,830 |
| 2013 | $1,116 | $18,060 | $2,230 | $15,830 |
Source: Public Records
Map
Nearby Homes
- 3504 Stratmore Ave
- 3927 Hopkins Rd
- 950 Donmar Ln
- 2002 Canfield Rd
- 3296 Cricket Dr
- 2127 Hermosa Dr
- 3282 Bears Den Rd
- 3726 Glenwood Ave
- 3206 Hermosa Dr
- 3941 S Schenley Ave
- 2426 Kirk Rd
- 29 Gillian Ln
- 4042 Baymar Dr
- 525 W Ravenwood Ave
- 4036 Stratford Rd
- 522 Parkcliffe Ave
- 2866 Peacock Dr
- 4478 Devonshire Dr Unit 1B
- 510 Parkcliffe Ave
- 2981 Louise Rita Ct
- 3614 Shelby Rd
- 3606 Shelby Rd
- 3618 Shelby Rd
- 3602 Shelby Rd
- 3615 Cascade Dr
- 3623 Cascade Dr
- 3611 Cascade Dr
- 3464 Shelby Rd
- 3622 Shelby Rd
- 3627 Cascade Dr
- 3607 Cascade Dr
- 3611 Shelby Rd
- 3607 Shelby Rd
- 3626 Shelby Rd
- 3631 Cascade Dr
- 3460 Shelby Rd
- 3615 Shelby Rd
- 3603 Cascade Dr
- 3603 Shelby Rd
- 3619 Shelby Rd