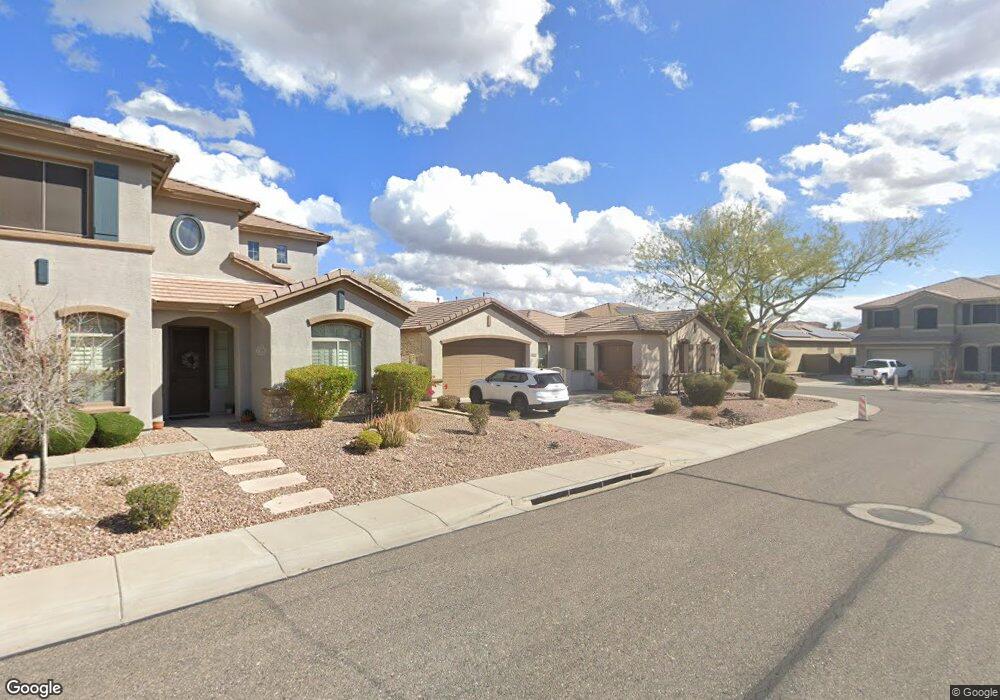
3610 W Links Dr Unit 63 Phoenix, AZ 85086
Estimated Value: $667,000 - $801,000
3
Beds
3
Baths
2,663
Sq Ft
$265/Sq Ft
Est. Value
About This Home
This home is located at 3610 W Links Dr Unit 63, Phoenix, AZ 85086 and is currently estimated at $706,988, approximately $265 per square foot. 3610 W Links Dr Unit 63 is a home located in Maricopa County with nearby schools including Canyon Springs STEM Academy, Boulder Creek High School, and Great Hearts Academies - Anthem Prep.
Ownership History
Date
Name
Owned For
Owner Type
Purchase Details
Closed on
Nov 2, 2010
Sold by
Asasp Quality Homes Llc
Bought by
Campbell Berta L
Current Estimated Value
Home Financials for this Owner
Home Financials are based on the most recent Mortgage that was taken out on this home.
Original Mortgage
$192,000
Outstanding Balance
$126,420
Interest Rate
4.23%
Mortgage Type
New Conventional
Estimated Equity
$580,568
Purchase Details
Closed on
Aug 23, 2010
Sold by
Chapman Jeffery and Chapman Katherine R
Bought by
Asap Quality Homes Llc
Purchase Details
Closed on
Aug 16, 2005
Sold by
Del Webbs Coventry Homes Inc
Bought by
Chapman Jeffery and Chapman Katherine R
Home Financials for this Owner
Home Financials are based on the most recent Mortgage that was taken out on this home.
Original Mortgage
$311,563
Interest Rate
5.87%
Mortgage Type
New Conventional
Create a Home Valuation Report for This Property
The Home Valuation Report is an in-depth analysis detailing your home's value as well as a comparison with similar homes in the area
Home Values in the Area
Average Home Value in this Area
Purchase History
| Date | Buyer | Sale Price | Title Company |
|---|---|---|---|
| Campbell Berta L | $240,000 | Title West Agency Llc | |
| Asap Quality Homes Llc | $191,500 | None Available | |
| Chapman Jeffery | $389,454 | Sun Title Agency Co | |
| Del Webbs Coventry Homes Inc | -- | Sun Title Agency Co |
Source: Public Records
Mortgage History
| Date | Status | Borrower | Loan Amount |
|---|---|---|---|
| Open | Campbell Berta L | $192,000 | |
| Previous Owner | Chapman Jeffery | $311,563 | |
| Closed | Chapman Jeffery | $77,890 |
Source: Public Records
Tax History Compared to Growth
Tax History
| Year | Tax Paid | Tax Assessment Tax Assessment Total Assessment is a certain percentage of the fair market value that is determined by local assessors to be the total taxable value of land and additions on the property. | Land | Improvement |
|---|---|---|---|---|
| 2025 | $3,664 | $35,652 | -- | -- |
| 2024 | $4,136 | $33,954 | -- | -- |
| 2023 | $4,136 | $49,610 | $9,920 | $39,690 |
| 2022 | $3,969 | $35,870 | $7,170 | $28,700 |
| 2021 | $4,034 | $33,480 | $6,690 | $26,790 |
| 2020 | $3,951 | $31,920 | $6,380 | $25,540 |
| 2019 | $3,876 | $30,310 | $6,060 | $24,250 |
| 2018 | $4,224 | $28,910 | $5,780 | $23,130 |
| 2017 | $3,228 | $27,560 | $5,510 | $22,050 |
| 2016 | $2,768 | $27,130 | $5,420 | $21,710 |
| 2015 | $2,686 | $25,730 | $5,140 | $20,590 |
Source: Public Records
Map
Nearby Homes
- 42424 N Gavilan Peak Pkwy Unit 33206
- 42424 N Gavilan Peak Pkwy Unit 63212
- 42424 N Gavilan Peak Pkwy Unit 14104
- 42424 N Gavilan Peak Pkwy Unit 33104
- 42424 N Gavilan Peak Pkwy Unit 55206
- 42424 N Gavilan Peak Pkwy Unit 7206
- 42424 N Gavilan Peak Pkwy Unit 4104
- 42424 N Gavilan Peak Pkwy Unit 59212
- 42424 N Gavilan Peak Pkwy Unit 19102
- 42424 N Gavilan Peak Pkwy Unit 57104
- 42424 N Gavilan Peak Pkwy Unit 42206
- 42905 N Ericson Ct Unit 20A
- 3330 W Ravina Ln Unit 22
- 42920 N Raleigh Ct Unit 20A
- 3748 W Rushmore Dr
- 3824 W Rushmore Dr Unit 20A
- 3704 W Vivian Ct
- 3629 W Magellan Dr
- 3673 W Bryce Ct
- 3220 W Feather Sound Dr
- 3616 W Links Dr
- 42432 N Acadia Way
- 42411 N Acadia Way
- 3622 W Links Dr
- 42417 N Acadia Way
- 3611 W Links Dr
- 3617 W Links Dr
- 42444 N Acadia Way
- 3605 W Links Dr
- 42423 N Acadia Way
- 3628 W Links Dr
- 3623 W Links Dr
- 42429 N Acadia Way
- 42512 N Acadia Way
- 3629 W Links Dr Unit 63
- 3634 W Links Dr Unit 63
- 3559 W Summit Walk Dr
- 42435 N Acadia Way
- 42441 N Acadia Way
- 3635 W Links Dr