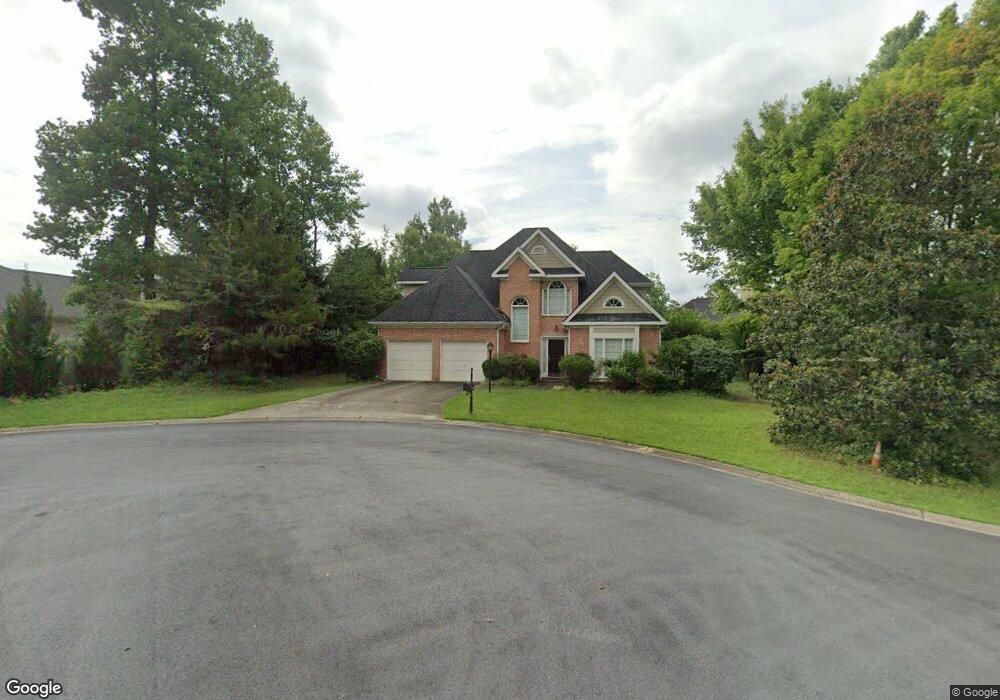
3611 Wyntering Trail Marietta, GA 30068
East Cobb NeighborhoodEstimated Value: $624,821 - $754,000
4
Beds
3
Baths
2,714
Sq Ft
$254/Sq Ft
Est. Value
About This Home
This home is located at 3611 Wyntering Trail, Marietta, GA 30068 and is currently estimated at $690,705, approximately $254 per square foot. 3611 Wyntering Trail is a home located in Cobb County with nearby schools including East Side Elementary School, Dodgen Middle School, and Walton High School.
Ownership History
Date
Name
Owned For
Owner Type
Purchase Details
Closed on
Oct 31, 2011
Sold by
Yan Hiu
Bought by
Zeng Xiaoyan
Current Estimated Value
Purchase Details
Closed on
Aug 23, 2002
Sold by
Olshevsky Vadim and Olshevsky Rozalia
Bought by
Yan Hui
Home Financials for this Owner
Home Financials are based on the most recent Mortgage that was taken out on this home.
Original Mortgage
$208,000
Interest Rate
6.49%
Mortgage Type
New Conventional
Purchase Details
Closed on
Nov 28, 1997
Sold by
Davis Sidney F and Davis Sue H
Bought by
Olshevsky Vadim and Olshevsky Rozalia
Home Financials for this Owner
Home Financials are based on the most recent Mortgage that was taken out on this home.
Original Mortgage
$168,000
Interest Rate
7.38%
Mortgage Type
New Conventional
Purchase Details
Closed on
May 18, 1994
Sold by
Mccar Development
Bought by
Davis Sidney F Sue H
Create a Home Valuation Report for This Property
The Home Valuation Report is an in-depth analysis detailing your home's value as well as a comparison with similar homes in the area
Home Values in the Area
Average Home Value in this Area
Purchase History
| Date | Buyer | Sale Price | Title Company |
|---|---|---|---|
| Zeng Xiaoyan | -- | -- | |
| Yan Hui | $260,000 | -- | |
| Olshevsky Vadim | $210,000 | -- | |
| Davis Sidney F Sue H | $42,100 | -- |
Source: Public Records
Mortgage History
| Date | Status | Borrower | Loan Amount |
|---|---|---|---|
| Previous Owner | Yan Hui | $208,000 | |
| Previous Owner | Olshevsky Vadim | $168,000 | |
| Closed | Davis Sidney F Sue H | -- |
Source: Public Records
Tax History Compared to Growth
Tax History
| Year | Tax Paid | Tax Assessment Tax Assessment Total Assessment is a certain percentage of the fair market value that is determined by local assessors to be the total taxable value of land and additions on the property. | Land | Improvement |
|---|---|---|---|---|
| 2025 | $5,946 | $250,784 | $70,000 | $180,784 |
| 2024 | $5,633 | $236,116 | $56,000 | $180,116 |
| 2023 | $3,526 | $164,000 | $36,000 | $128,000 |
| 2022 | $4,100 | $164,000 | $36,000 | $128,000 |
| 2021 | $4,225 | $169,732 | $36,000 | $133,732 |
| 2020 | $3,924 | $156,000 | $36,000 | $120,000 |
| 2019 | $3,924 | $156,000 | $36,000 | $120,000 |
| 2018 | $3,924 | $156,000 | $36,000 | $120,000 |
| 2017 | $4,083 | $168,888 | $36,000 | $132,888 |
| 2016 | $3,606 | $146,908 | $36,000 | $110,908 |
| 2015 | $3,681 | $146,908 | $36,000 | $110,908 |
| 2014 | $2,883 | $110,208 | $0 | $0 |
Source: Public Records
Map
Nearby Homes
- 3700 Robinson Rd NE
- 1257 Independence Way
- 3506 Clubland Dr Unit 6
- 3570 Brighton Place
- 3792 Raccoon Run
- 718 Trevett Way
- 1200 Mitsy Forest Dr NE
- 3769 High Green Dr
- 3542 Clubland Dr
- 1195 Fielding Way
- 3760 Creekstone Way
- 4121 Fawn Ct
- 1164 Fairfield Dr
- 3442 Fox Hollow Dr
- 870 Muirfield Trace
- 0 Old Canton Rd NE Unit 10567243
- 0 Old Canton Rd NE Unit 7617214
- 1038 Seven Springs Cir
- 1120 Taliwa Trail NE
- 3615 Wyntering Trail
- 3614 Sadlers Walk
- 3616 Sadlers Walk
- 3619 Wyntering Trail
- 3618 Sadlers Walk
- 3612 Sadlers Walk
- 3621 Wyntering Trail
- 3612 Wyntering Trail
- 3608 Wyntering Trail
- 3608 Wyntering Trail Unit 14
- 3600 Wyntering Trail
- 3616 Wyntering Trail
- 3620 Sadlers Walk
- 3620 Wyntering Trail
- 3604 Wyntering Trail
- 3631 Wyntering Trail
- 1123 Sadlers Way
- 0 Sadlers Walk
- 3622 Sadlers Walk
- 3611 Sadlers Walk