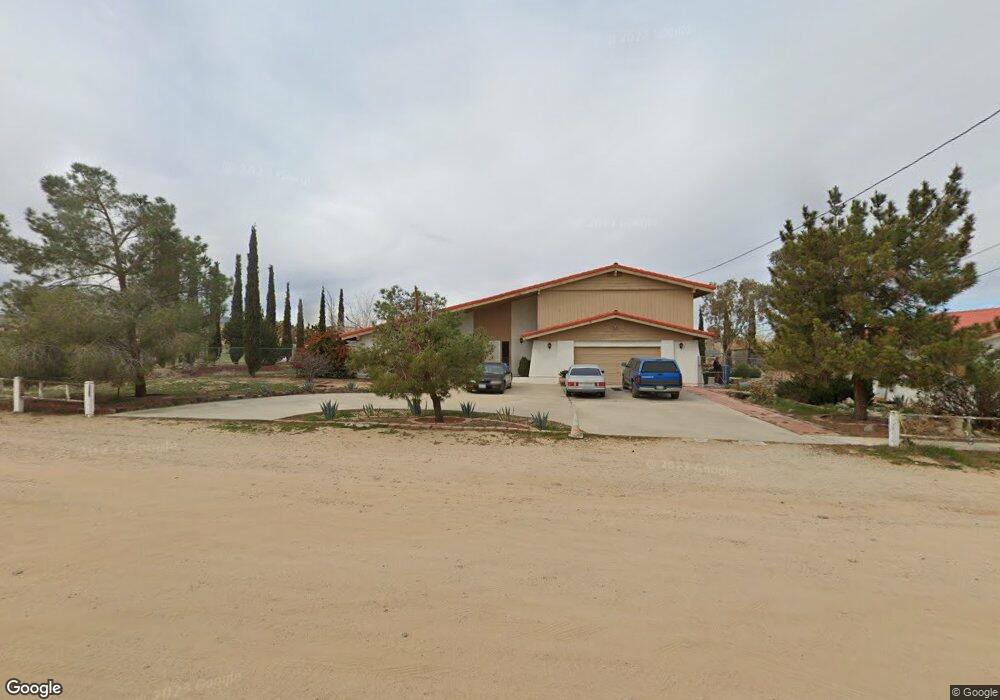
36111 53rd St E Palmdale, CA 93552
Southeast Antelope Valley NeighborhoodEstimated Value: $602,797 - $641,000
3
Beds
3
Baths
2,517
Sq Ft
$244/Sq Ft
Est. Value
About This Home
This home is located at 36111 53rd St E, Palmdale, CA 93552 and is currently estimated at $613,699, approximately $243 per square foot. 36111 53rd St E is a home located in Los Angeles County with nearby schools including Buena Vista Elementary School, Desert Willow Fine Arts, Science, & Technology Magnet Academy, and Knight High School.
Ownership History
Date
Name
Owned For
Owner Type
Purchase Details
Closed on
Jun 27, 2001
Sold by
Dittus Paul P
Bought by
Dittus Paul P
Current Estimated Value
Home Financials for this Owner
Home Financials are based on the most recent Mortgage that was taken out on this home.
Original Mortgage
$216,000
Outstanding Balance
$82,938
Interest Rate
7.09%
Estimated Equity
$530,761
Purchase Details
Closed on
Mar 2, 2001
Sold by
Dittus Cynthia A
Bought by
Dittus Paul P
Purchase Details
Closed on
Aug 19, 1993
Sold by
Va
Bought by
Bixler Audie G
Home Financials for this Owner
Home Financials are based on the most recent Mortgage that was taken out on this home.
Original Mortgage
$184,701
Interest Rate
7.25%
Purchase Details
Closed on
Jul 27, 1993
Sold by
Bixler Audie G and Bixler Mikelyn
Bought by
Dittus Paul P
Home Financials for this Owner
Home Financials are based on the most recent Mortgage that was taken out on this home.
Original Mortgage
$184,701
Interest Rate
7.25%
Create a Home Valuation Report for This Property
The Home Valuation Report is an in-depth analysis detailing your home's value as well as a comparison with similar homes in the area
Home Values in the Area
Average Home Value in this Area
Purchase History
| Date | Buyer | Sale Price | Title Company |
|---|---|---|---|
| Dittus Paul P | -- | Chicago Title Co | |
| Dittus Paul P | -- | -- | |
| Bixler Audie G | -- | World Title Company | |
| Dittus Paul P | $204,000 | World Title Company |
Source: Public Records
Mortgage History
| Date | Status | Borrower | Loan Amount |
|---|---|---|---|
| Open | Dittus Paul P | $216,000 | |
| Previous Owner | Dittus Paul P | $184,701 |
Source: Public Records
Tax History
| Year | Tax Paid | Tax Assessment Tax Assessment Total Assessment is a certain percentage of the fair market value that is determined by local assessors to be the total taxable value of land and additions on the property. | Land | Improvement |
|---|---|---|---|---|
| 2025 | $5,170 | $414,233 | $71,196 | $343,037 |
| 2024 | $5,170 | $406,111 | $69,800 | $336,311 |
| 2023 | $5,024 | $398,149 | $68,432 | $329,717 |
| 2022 | $4,809 | $390,343 | $67,091 | $323,252 |
| 2021 | $4,736 | $382,690 | $65,776 | $316,914 |
| 2019 | $4,565 | $371,341 | $63,826 | $307,515 |
| 2018 | $4,527 | $364,061 | $62,575 | $301,486 |
| 2016 | $4,160 | $349,927 | $60,147 | $289,780 |
| 2015 | $4,150 | $344,672 | $59,244 | $285,428 |
| 2014 | $4,153 | $337,921 | $58,084 | $279,837 |
Source: Public Records
Map
Nearby Homes
- 5204 E Avenue t4
- 5040 E Avenue t8
- 0 Vic Avenue T12 Vic 52nd Ste Unit 25007973
- 50 E 50th St Unit Ste Vic
- 5105 Spyglass Dr
- 0 E Avenue T 8
- 4832 Summerbreeze Ct
- 5849 E Avenue t8
- 0 47th St E Unit V7 25002798
- 36403 Chalone Dr
- 5640 Eisenhower Way
- 0 Pearblossom Hwy Vic 62nd E Unit 24003486
- 0 Pearblossom Hwy Unit IV25181913
- 6150 E Avenue T Unit 49
- 6150 E Avenue T Unit 36
- 36807 Haven Ct
- 36634 Sulphur Springs Rd
- 36324 43rd St E
- 36843 Hillcrest Dr
- 6386 Pearblossom Hwy
- 36118 53rd St E
- 36130 52nd St E
- 5250 E Avenue t4
- 36044 52nd St E
- 36011 53rd St E
- 36020 53rd St E
- 36041 55th St E
- 5315 E Avenue t4
- 5344 E Avenue t4
- 5211 E Avenue t8
- 0 E Avenue t4 Unit EV17238802
- 0 E Avenue t4 Unit 17011442
- 0 E Avenue t4 Unit 491751
- 36225 53rd St E
- 35977 53rd St E
- 36064 55th St E
- 36005 55th St E
- 36048 Vac 55th Ste Vic Avenue T8
- 36110 55th St E
- 35974 53rd St E
Your Personal Tour Guide
Ask me questions while you tour the home.