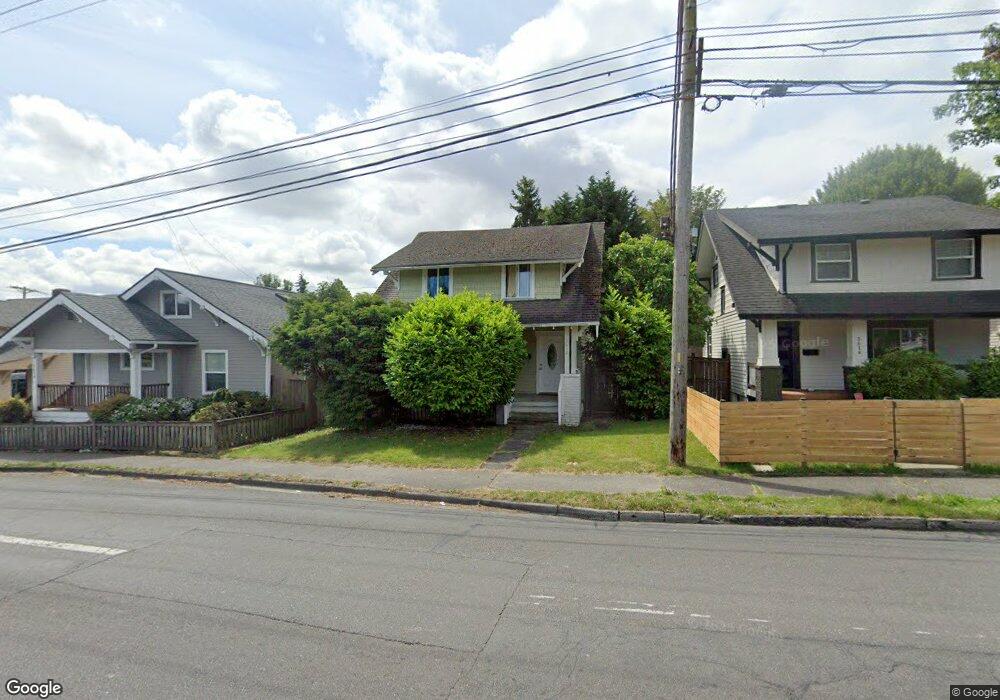
3612 S 12th St Tacoma, WA 98405
Central Tacoma NeighborhoodEstimated Value: $504,725 - $557,000
3
Beds
1
Bath
1,200
Sq Ft
$441/Sq Ft
Est. Value
About This Home
This home is located at 3612 S 12th St, Tacoma, WA 98405 and is currently estimated at $528,681, approximately $440 per square foot. 3612 S 12th St is a home located in Pierce County with nearby schools including Franklin Elementary School, Mason Middle School, and Foss High School.
Ownership History
Date
Name
Owned For
Owner Type
Purchase Details
Closed on
Dec 19, 2014
Sold by
Pye Demetrius
Bought by
Dt Investment & Property Management Llc
Current Estimated Value
Purchase Details
Closed on
Jan 16, 2006
Sold by
Farmer Nina C and Farmer Jones Nina C
Bought by
Pye Demetrius
Home Financials for this Owner
Home Financials are based on the most recent Mortgage that was taken out on this home.
Original Mortgage
$150,300
Interest Rate
9.39%
Mortgage Type
Fannie Mae Freddie Mac
Purchase Details
Closed on
Jan 17, 2002
Sold by
Schramek Geoffrey
Bought by
Farmer Nina C
Home Financials for this Owner
Home Financials are based on the most recent Mortgage that was taken out on this home.
Original Mortgage
$90,000
Interest Rate
7.5%
Purchase Details
Closed on
Aug 24, 1999
Sold by
Transamerican Capital Management Inc
Bought by
Metropolitan Asset Funding Inc Ii
Purchase Details
Closed on
Feb 10, 1994
Sold by
Hamlin Mark J and Hamlin Linda
Bought by
Watkins Joseph L and Hendricks Watkins Monica C
Create a Home Valuation Report for This Property
The Home Valuation Report is an in-depth analysis detailing your home's value as well as a comparison with similar homes in the area
Home Values in the Area
Average Home Value in this Area
Purchase History
| Date | Buyer | Sale Price | Title Company |
|---|---|---|---|
| Dt Investment & Property Management Llc | -- | None Available | |
| Pye Demetrius | $167,000 | Lawyers Title Agency Of Sout | |
| Farmer Nina C | $130,882 | Fidelity National Title Co | |
| Metropolitan Asset Funding Inc Ii | $91,921 | -- | |
| Watkins Joseph L | -- | First American Title Ins Co |
Source: Public Records
Mortgage History
| Date | Status | Borrower | Loan Amount |
|---|---|---|---|
| Previous Owner | Pye Demetrius | $150,300 | |
| Previous Owner | Farmer Nina C | $90,000 | |
| Closed | Farmer Nina C | $22,500 |
Source: Public Records
Tax History Compared to Growth
Tax History
| Year | Tax Paid | Tax Assessment Tax Assessment Total Assessment is a certain percentage of the fair market value that is determined by local assessors to be the total taxable value of land and additions on the property. | Land | Improvement |
|---|---|---|---|---|
| 2025 | $4,476 | $425,800 | $207,500 | $218,300 |
| 2024 | $4,476 | $422,400 | $200,000 | $222,400 |
| 2023 | $4,476 | $401,900 | $192,500 | $209,400 |
| 2022 | $4,083 | $416,300 | $182,700 | $233,600 |
| 2021 | $3,865 | $307,400 | $116,100 | $191,300 |
| 2019 | $3,313 | $286,900 | $98,200 | $188,700 |
| 2018 | $3,475 | $254,800 | $86,000 | $168,800 |
| 2017 | $3,107 | $219,900 | $60,300 | $159,600 |
| 2016 | $2,720 | $167,700 | $44,000 | $123,700 |
| 2014 | $2,418 | $156,400 | $38,600 | $117,800 |
| 2013 | $2,418 | $141,800 | $36,300 | $105,500 |
Source: Public Records
Map
Nearby Homes
- 3606 S 12th St
- 1231 S Washington St
- 3517 S 11th St
- 3515 S 11th St
- 3417 S 12th St
- 3820 S 12th St
- 1002 S Washington St
- 3824 S 12th St
- 1404 S Adams St
- 1301 S Durango St
- 1246 S Durango St
- 819 S Adams St
- 716 S Puget Sound Ave
- 1026 S Monroe St
- 3501 6th Ave
- 3310 6th Ave Unit A-C
- 3108 S 8th St
- 1720 S Durango St
- 4014 S 17th St
- 3120 S 17th St
- 3608 S 12th St
- 3614 S 12th St
- 1209 S Washington St
- 1210 S Union Ave
- 1211 S Washington St
- 1214 S Union Ave
- 1217 S Washington St
- 3611 S 12th St
- 1216 S Union Ave
- 3615 S 12th St
- 3601 S 12th St
- 3617 S 12th St
- 1220 S Union Ave
- 1219 S Washington St
- 1202 S Washington St
- 3623 S 12th St
- 1201 S Union Ave Unit 3
- 1201 S Union Ave Unit 1
- 1210 S Washington St
- 1222 S Union Ave