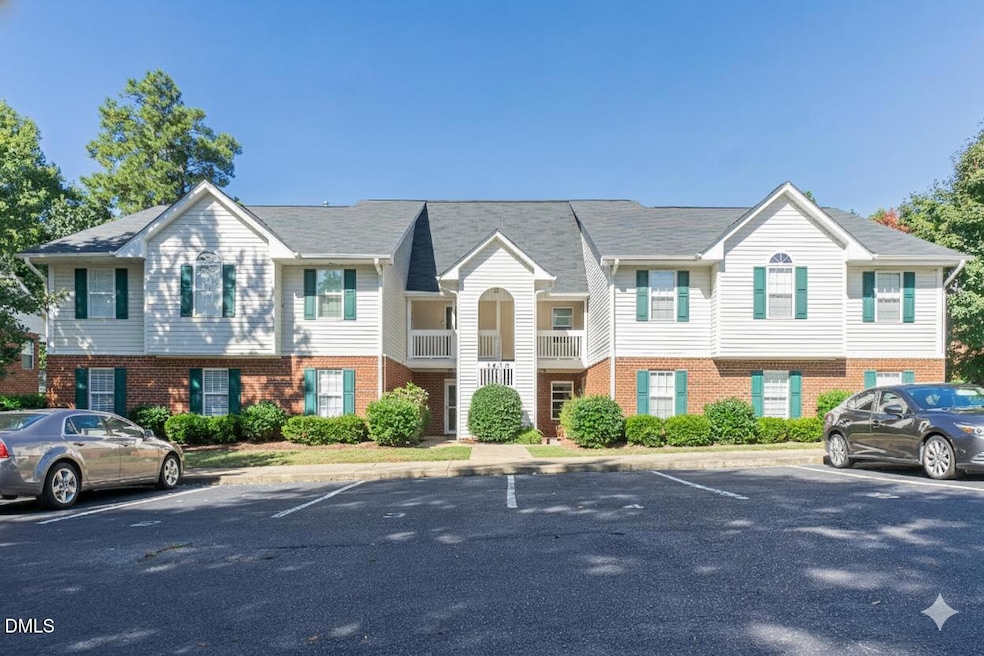
3612 Wellington Ridge Loop Cary, NC 27518
Crossroads NeighborhoodEstimated payment $2,036/month
Highlights
- Traditional Architecture
- Main Floor Bedroom
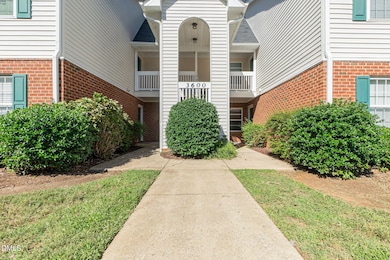
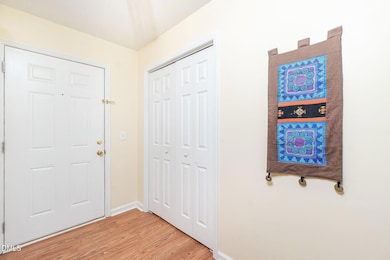
- Entrance Foyer
- Wood Flooring
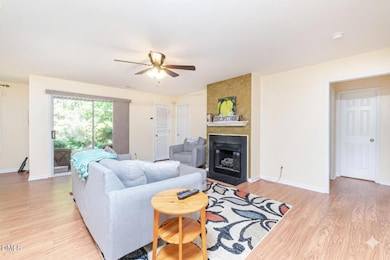
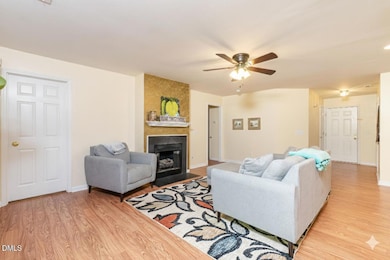
- Living Room
- 1-Story Property
About This Home
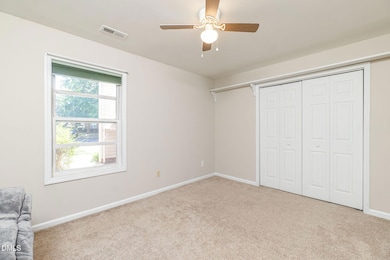
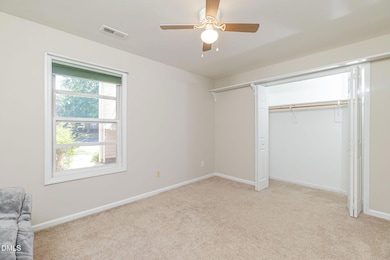
Discover easy living in this beautifully 2 bedroom, 2 bath condo featuring an open floor plan and peaceful wooded views. Located on the first floor for effortless access, this home offers a perfect blend of comfort and convenience. The spacious primary suite includes a large walk-in closet, whirlpool soaking tub, and separate shower. The living room features a cozy gas-log fireplace, ideal for relaxing or entertaining. You'll appreciate the ample storage, plus washer, and dryer all included. Step outside to your large covered patio, perfect for morning coffee or evening unwinding. Enjoy walking trails just behind the home and nearby city parks that make it easy to stay active and connected with nature. Just minutes to grocery stores and Crossroads shopping. Conveniently located to Raleigh (22 minutes) and RTP (28 minutes)! Residents love the community amenities, including a pool and HOA-covered water and trash service - all designed for a low-maintenance, stress-free lifestyle. This home combines modern comfort, natural surroundings, and unbeatable convenience- a rare find at this price point!
Property Details
Home Type
- Condominium
Est. Annual Taxes
- $2,271
Year Built
- Built in 1997
HOA Fees
- $342 Monthly HOA Fees
Home Design
- Traditional Architecture
- Brick Exterior Construction
- Shingle Roof
Interior Spaces
- 1,149 Sq Ft Home
- 1-Story Property
- Entrance Foyer
- Living Room
- Dining Room
- Crawl Space
Flooring
- Wood
- Carpet
- Tile
Bedrooms and Bathrooms
- 2 Main Level Bedrooms
- 2 Full Bathrooms
Parking
- 2 Parking Spaces
- Assigned Parking
Schools
- Dillard Elementary And Middle School
- Athens Dr High School
Utilities
- Forced Air Heating and Cooling System
Community Details
- Association fees include ground maintenance, sewer, trash, water
- Cas Nc Association, Phone Number (919) 788-9911
- Wellington Ridge Subdivision
Listing and Financial Details
- Assessor Parcel Number 0762986244
Map
Home Values in the Area
Average Home Value in this Area
Tax History
| Year | Tax Paid | Tax Assessment Tax Assessment Total Assessment is a certain percentage of the fair market value that is determined by local assessors to be the total taxable value of land and additions on the property. | Land | Improvement |
|---|---|---|---|---|
| 2025 | $2,430 | $281,214 | -- | $281,214 |
| 2024 | $2,203 | $260,374 | $0 | $260,374 |
| 2023 | $1,775 | $175,128 | $0 | $175,128 |
| 2022 | $1,709 | $175,128 | $0 | $175,128 |
| 2021 | $1,675 | $175,128 | $0 | $175,128 |
| 2020 | $1,684 | $175,128 | $0 | $175,128 |
| 2019 | $1,312 | $120,685 | $0 | $120,685 |
| 2018 | $1,232 | $120,685 | $0 | $120,685 |
| 2017 | $1,185 | $120,685 | $0 | $120,685 |
| 2016 | $1,167 | $120,685 | $0 | $120,685 |
| 2015 | $1,149 | $114,682 | $0 | $114,682 |
| 2014 | $1,084 | $114,682 | $0 | $114,682 |
Property History
| Date | Event | Price | List to Sale | Price per Sq Ft |
|---|---|---|---|---|
| 11/14/2025 11/14/25 | For Sale | $285,000 | 0.0% | $248 / Sq Ft |
| 11/08/2025 11/08/25 | Pending | -- | -- | -- |
| 11/05/2025 11/05/25 | For Sale | $285,000 | -- | $248 / Sq Ft |
Purchase History
| Date | Type | Sale Price | Title Company |
|---|---|---|---|
| Warranty Deed | $310,000 | Investors Title | |
| Warranty Deed | $310,000 | Investors Title | |
| Warranty Deed | $129,500 | None Available | |
| Warranty Deed | $95,000 | None Available | |
| Warranty Deed | $112,500 | None Available | |
| Warranty Deed | $105,000 | -- |
Mortgage History
| Date | Status | Loan Amount | Loan Type |
|---|---|---|---|
| Open | $248,000 | New Conventional | |
| Closed | $248,000 | New Conventional | |
| Previous Owner | $116,550 | New Conventional | |
| Previous Owner | $86,249 | New Conventional | |
| Previous Owner | $60,000 | New Conventional | |
| Previous Owner | $84,000 | Fannie Mae Freddie Mac | |
| Closed | $15,750 | No Value Available |
Source: Doorify MLS
MLS Number: 10131435
APN: 0762.08-98-6244-006
Disclaimer: Certain information contained herein is derived from information provided by parties other than Homes.com. All information provided is deemed reliable, but is not guaranteed to be accurate and should be independently verified.
![]() Some IDX listings have been excluded from this IDX display. Brokers make an effort to deliver accurate information, but buyers should independently verify any information on which they will rely in a transaction. The listing broker shall not be responsible for any typographical errors, misinformation, or misprints, and they shall be held totally harmless from any damages arising from reliance upon this data. This data is provided exclusively for consumers’ personal, non-commercial use. Listings marked with an icon are provided courtesy of the Doorify MLS, Inc. of North Carolina, Internet Data Exchange Database. Closed (sold) listings may have been listed and/or sold by a real estate firm other than the firm(s) featured on this website. Closed data is not available until the sale of the property is recorded in the MLS. Home sale data is not an appraisal, CMA, competitive or comparative market analysis, or home valuation of any property. Copyright 2025 Doorify MLS, Inc. of North Carolina. All rights reserved.
Some IDX listings have been excluded from this IDX display. Brokers make an effort to deliver accurate information, but buyers should independently verify any information on which they will rely in a transaction. The listing broker shall not be responsible for any typographical errors, misinformation, or misprints, and they shall be held totally harmless from any damages arising from reliance upon this data. This data is provided exclusively for consumers’ personal, non-commercial use. Listings marked with an icon are provided courtesy of the Doorify MLS, Inc. of North Carolina, Internet Data Exchange Database. Closed (sold) listings may have been listed and/or sold by a real estate firm other than the firm(s) featured on this website. Closed data is not available until the sale of the property is recorded in the MLS. Home sale data is not an appraisal, CMA, competitive or comparative market analysis, or home valuation of any property. Copyright 2025 Doorify MLS, Inc. of North Carolina. All rights reserved.
- 4311 Wellington Ridge Loop
- 1221 Renshaw Ct
- 304 W Kirkfield Dr
- 1641 Kildonan Place
- 2414 Stephens Rd
- 111 W Laurenbrook Ct
- 1640 Glengarry Dr
- 0 SE Cary Pkwy Unit 2491180
- 301 Dunhagan Place
- 307 Durington Place
- 115 Woodruff Ct
- 312 Heidinger Dr
- 6315 Tryon Rd
- 104 Catherwood Place
- 2434 Stephens Rd
- 106 Frank Rd
- 1331 Kingston Ridge Rd
- 105 Crosswaite Way
- 109 Beaver Pine Way
- 121 Bay Dr
- 305 Durington Place
- 4101 Skye Ln
- 2200 Piney Plains Rd Unit ID1338737P
- 10300 Kingsclere Dr
- 6000 Scarlet Sky Ln
- 6000 Scarlet Sky Ln Unit ID1225911P
- 6000 Scarlet Sky Ln Unit ID1225816P
- 333 Putney Dr
- 200 Brisbane Woods Way
- 7029 Almaden Way Unit ID1284648P
- 7029 Almaden Way Unit FL3-ID1093326P
- 2015 Piney Plains Rd
- 7011 Almaden Way Unit ID1094294P
- 7011 Almaden Way Unit ID1284644P
- 1803 Brisbane Woods Way Unit ID1284685P
- 2431 Brisbane Woods Way Unit ID1262811P
- 2212 Brisbane Woods Way Unit ID1225815P
- 7617 Almaden Way Unit ID1284647P
- 100 Eclipse Dr
- 8226 Hydon Dawn Ln Unit FL3-ID1094292P
