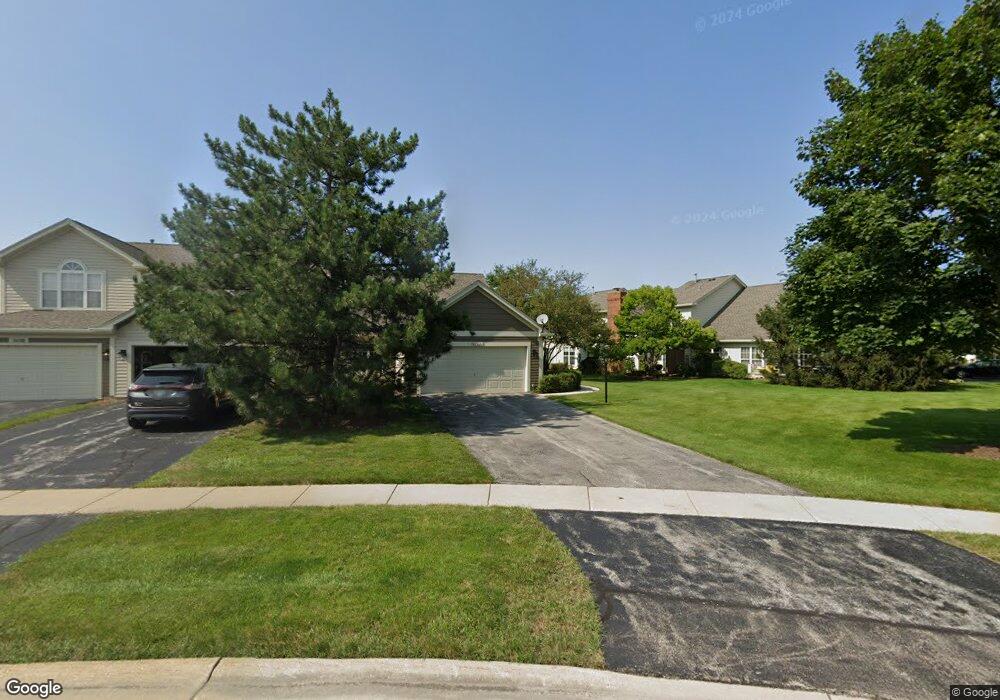
36122 N Springbrook Ln Gurnee, IL 60031
Estimated Value: $276,000 - $308,000
2
Beds
2
Baths
1,286
Sq Ft
$225/Sq Ft
Est. Value
About This Home
This home is located at 36122 N Springbrook Ln, Gurnee, IL 60031 and is currently estimated at $289,713, approximately $225 per square foot. 36122 N Springbrook Ln is a home located in Lake County with nearby schools including Woodland Primary School, Woodland Intermediate School, and Woodland Elementary School.
Ownership History
Date
Name
Owned For
Owner Type
Purchase Details
Closed on
Jul 16, 1999
Sold by
Salstrom Janet L
Bought by
Pann John A and Pann Peggy
Current Estimated Value
Home Financials for this Owner
Home Financials are based on the most recent Mortgage that was taken out on this home.
Original Mortgage
$130,200
Outstanding Balance
$36,614
Interest Rate
7.61%
Estimated Equity
$253,099
Purchase Details
Closed on
Sep 16, 1998
Sold by
Salstrom Susan C
Bought by
Salstrom Janet L and Janet L Salstrom Living Trust
Purchase Details
Closed on
Jan 31, 1994
Sold by
Fan Connie
Bought by
Salstrom Susan C
Home Financials for this Owner
Home Financials are based on the most recent Mortgage that was taken out on this home.
Original Mortgage
$62,000
Interest Rate
7.22%
Create a Home Valuation Report for This Property
The Home Valuation Report is an in-depth analysis detailing your home's value as well as a comparison with similar homes in the area
Home Values in the Area
Average Home Value in this Area
Purchase History
| Date | Buyer | Sale Price | Title Company |
|---|---|---|---|
| Pann John A | $140,000 | -- | |
| Salstrom Janet L | $140,500 | -- | |
| Salstrom Susan C | $92,000 | Chicago Title Insurance Co |
Source: Public Records
Mortgage History
| Date | Status | Borrower | Loan Amount |
|---|---|---|---|
| Open | Pann John A | $130,200 | |
| Previous Owner | Salstrom Susan C | $62,000 |
Source: Public Records
Tax History Compared to Growth
Tax History
| Year | Tax Paid | Tax Assessment Tax Assessment Total Assessment is a certain percentage of the fair market value that is determined by local assessors to be the total taxable value of land and additions on the property. | Land | Improvement |
|---|---|---|---|---|
| 2024 | $3,739 | $81,036 | $11,537 | $69,499 |
| 2023 | $4,452 | $73,043 | $10,399 | $62,644 |
| 2022 | $4,452 | $59,144 | $9,270 | $49,874 |
| 2021 | $4,222 | $56,771 | $8,898 | $47,873 |
| 2020 | $4,176 | $55,375 | $8,679 | $46,696 |
| 2019 | $4,170 | $53,767 | $8,427 | $45,340 |
| 2018 | $3,275 | $45,719 | $6,751 | $38,968 |
| 2017 | $3,269 | $44,409 | $6,558 | $37,851 |
| 2016 | $3,217 | $42,432 | $6,266 | $36,166 |
| 2015 | $3,067 | $40,243 | $5,943 | $34,300 |
| 2014 | $3,124 | $41,894 | $5,864 | $36,030 |
| 2012 | $3,724 | $42,215 | $5,909 | $36,306 |
Source: Public Records
Map
Nearby Homes
- 36217 N Old Creek Ct
- 36259 N Field View Dr
- 17775 W Braewick Rd
- 17820 W Braewick Rd
- 17781 W Elsbury St
- 6797 Roanoake Ct
- 17876 W Braewick Rd
- 6877 W Mount Vernon Ct Unit 4A
- 17917 W Pond Ridge Cir
- 18229 W Banbury Dr
- 17925 W Stearns School Rd
- 0 Hunt Club Rd Unit MRD12261326
- 1603 Napa Dr
- 18325 W Lakeview Terrace
- 1075 Suffolk Ct
- 1593 Vineyard Dr
- 6401 Davidson Ct
- 6409 Davidson Ct
- 7623 Beringer Ct
- 7631 Beringer Ct
- 36120 N Springbrook Ln
- 36118 N Springbrook Ln
- 36116 N Springbrook Ln
- 36128 N Springbrook Ln
- 36130 N Springbrook Ln
- 36132 N Springbrook Ln
- 36134 N Springbrook Ln
- 36108 N Springbrook Ln
- 36140 N Springbrook Ln
- 36106 N Springbrook Ln
- 36102 N New Bridge Ct
- 36104 N Springbrook Ln
- 36144 N Springbrook Ln
- 36102 N Springbrook Ln
- 36102 N Springbrook Ln Unit 1
- 36146 N Springbrook Ln
- 36100 N New Bridge Ct
- 36093 N Springbrook Ln
- 36123 N New Bridge Ct
- 36091 N Springbrook Ln