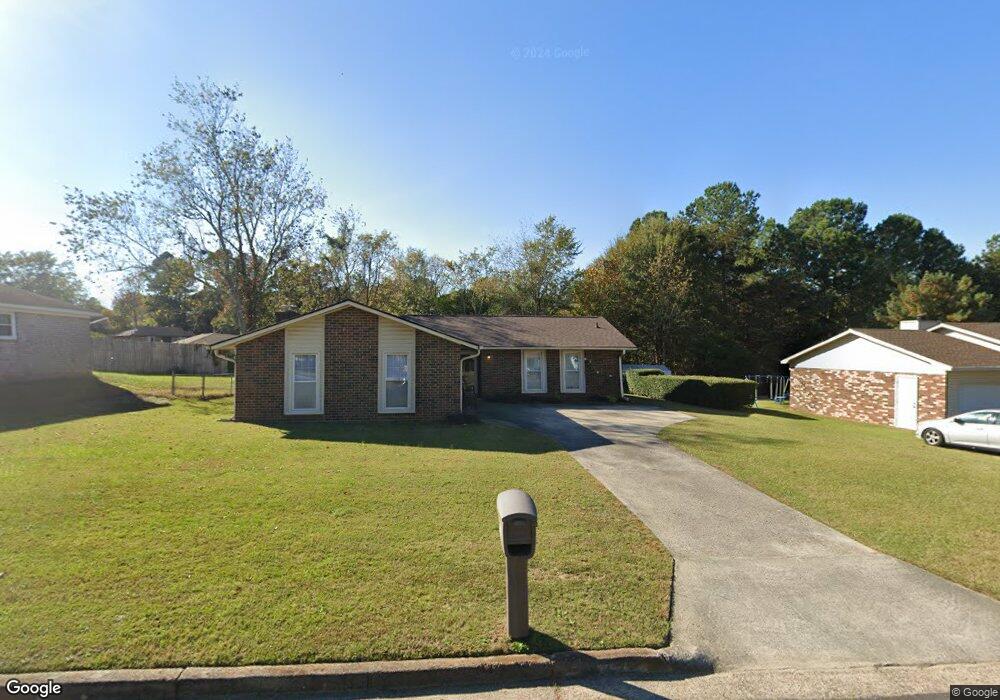
3615 Quail Hollow Dr Hephzibah, GA 30815
Windsor Spring NeighborhoodEstimated Value: $187,000 - $226,000
3
Beds
2
Baths
1,915
Sq Ft
$110/Sq Ft
Est. Value
About This Home
This home is located at 3615 Quail Hollow Dr, Hephzibah, GA 30815 and is currently estimated at $210,737, approximately $110 per square foot. 3615 Quail Hollow Dr is a home located in Richmond County with nearby schools including Jamestown Elementary School, Glenn Hills Middle School, and Johnson Magnet.
Ownership History
Date
Name
Owned For
Owner Type
Purchase Details
Closed on
Jan 14, 2000
Sold by
Va
Bought by
Dent Angela
Current Estimated Value
Home Financials for this Owner
Home Financials are based on the most recent Mortgage that was taken out on this home.
Original Mortgage
$72,000
Outstanding Balance
$22,556
Interest Rate
7.87%
Estimated Equity
$188,181
Purchase Details
Closed on
Dec 1, 1998
Sold by
Norwest Mtg Inc
Bought by
Va
Purchase Details
Closed on
May 9, 1996
Sold by
Goldstein Brigitte G By Atty
Bought by
Summerour Beverly C Summerour Gary
Purchase Details
Closed on
May 7, 1996
Sold by
Goldstein Brigitte
Bought by
Summerour Beverly C
Purchase Details
Closed on
May 6, 1992
Sold by
Goldstein William B
Bought by
Goldstein Brigitte G
Purchase Details
Closed on
Apr 13, 1992
Sold by
Goldstein William B
Bought by
Goldstein Brigitte
Create a Home Valuation Report for This Property
The Home Valuation Report is an in-depth analysis detailing your home's value as well as a comparison with similar homes in the area
Home Values in the Area
Average Home Value in this Area
Purchase History
| Date | Buyer | Sale Price | Title Company |
|---|---|---|---|
| Dent Angela | -- | -- | |
| Va | -- | -- | |
| Summerour Beverly C Summerour Gary | -- | -- | |
| Summerour Beverly C | $86,900 | -- | |
| Goldstein Brigitte G | -- | -- | |
| Goldstein Brigitte | -- | -- |
Source: Public Records
Mortgage History
| Date | Status | Borrower | Loan Amount |
|---|---|---|---|
| Open | Dent Angela | $72,000 |
Source: Public Records
Tax History Compared to Growth
Tax History
| Year | Tax Paid | Tax Assessment Tax Assessment Total Assessment is a certain percentage of the fair market value that is determined by local assessors to be the total taxable value of land and additions on the property. | Land | Improvement |
|---|---|---|---|---|
| 2025 | $1,894 | $58,008 | $6,480 | $51,528 |
| 2024 | $1,894 | $70,288 | $6,480 | $63,808 |
| 2023 | $1,320 | $59,396 | $6,480 | $52,916 |
| 2022 | $1,530 | $45,522 | $6,480 | $39,042 |
| 2021 | $1,230 | $32,144 | $6,480 | $25,664 |
| 2020 | $1,214 | $32,144 | $6,480 | $25,664 |
| 2019 | $1,274 | $32,144 | $6,480 | $25,664 |
| 2018 | $1,281 | $32,144 | $6,480 | $25,664 |
| 2017 | $1,239 | $32,144 | $6,480 | $25,664 |
| 2016 | $1,240 | $32,144 | $6,480 | $25,664 |
| 2015 | $1,247 | $32,144 | $6,480 | $25,664 |
| 2014 | $1,221 | $31,311 | $6,480 | $24,831 |
Source: Public Records
Map
Nearby Homes
- 3806 Highpointe Dr
- 3936 Ellen St
- 3947 Ellen St
- 3510 Andover Dr
- 3656 Woodcock Dr
- 3011 White Sand Dr
- 3904 Ellen St
- 407 Woodhazel Way
- 3426 Firestone Dr Unit 154
- 3436 Firestone Dr
- 3438 Firestone Dr
- 3442 Firestone Dr
- 4386 Creekview Dr
- 3462 Firestone Dr
- 3466 Firestone Dr
- 2614 Sadie Ct
- 3492 Firestone Dr
- 5446 Thrasher Ln
- 3422 Firestone Dr
- 3434 Firestone Dr Unit 151
- 3613 Quail Hollow Dr
- 3617 Quail Hollow Dr
- 2705 Bob White Ct
- 3623 Quail Hollow Dr
- 2703 Bob White Ct
- 2707 Bob White Ct
- 2702 Partridge Place
- 3618 Quail Hollow Dr
- 3620 Quail Hollow Dr
- 3619 Quail Hollow Dr
- 3616 Quail Hollow Dr
- 3622 Quail Hollow Dr
- 3614 Quail Hollow Dr
- 2708 Bob White Ct
- 2706 Bob White Ct
- 3612 Quail Hollow Dr
- 3626 Quail Hollow Dr
- 2710 Bob White Ct