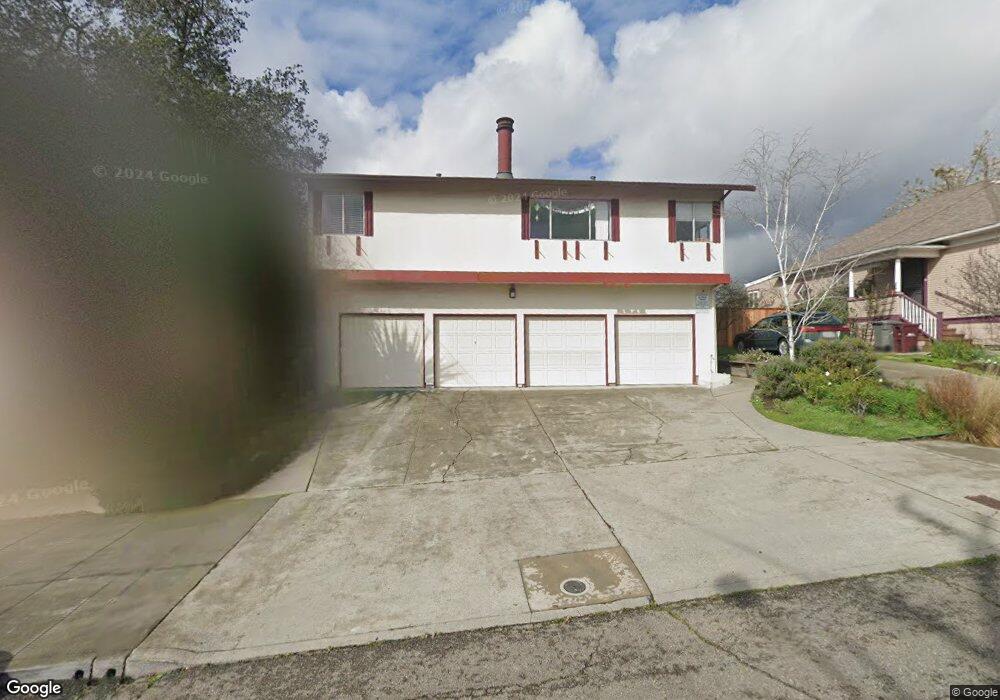
3615 Rhoda Ave Unit 4 Oakland, CA 94602
Dimond District NeighborhoodEstimated Value: $388,440 - $509,000
2
Beds
2
Baths
960
Sq Ft
$454/Sq Ft
Est. Value
About This Home
This home is located at 3615 Rhoda Ave Unit 4, Oakland, CA 94602 and is currently estimated at $435,610, approximately $453 per square foot. 3615 Rhoda Ave Unit 4 is a home located in Alameda County with nearby schools including Sequoia Elementary School, Bret Harte Middle School, and Skyline High School.
Ownership History
Date
Name
Owned For
Owner Type
Purchase Details
Closed on
Jun 10, 2015
Sold by
Miles Randy S
Bought by
Miles Randy S and Binder James L
Current Estimated Value
Home Financials for this Owner
Home Financials are based on the most recent Mortgage that was taken out on this home.
Original Mortgage
$361,550
Outstanding Balance
$280,230
Interest Rate
3.77%
Mortgage Type
VA
Estimated Equity
$155,380
Purchase Details
Closed on
Dec 14, 2012
Sold by
Tayaba Christine M
Bought by
Miles Randy S
Home Financials for this Owner
Home Financials are based on the most recent Mortgage that was taken out on this home.
Original Mortgage
$159,101
Interest Rate
3.37%
Mortgage Type
VA
Purchase Details
Closed on
Mar 18, 2004
Sold by
Shelton Jennifer G
Bought by
Tayaba Christine M
Home Financials for this Owner
Home Financials are based on the most recent Mortgage that was taken out on this home.
Original Mortgage
$299,250
Interest Rate
5.25%
Mortgage Type
New Conventional
Create a Home Valuation Report for This Property
The Home Valuation Report is an in-depth analysis detailing your home's value as well as a comparison with similar homes in the area
Home Values in the Area
Average Home Value in this Area
Purchase History
| Date | Buyer | Sale Price | Title Company |
|---|---|---|---|
| Miles Randy S | -- | First Amer Title San Diego | |
| Miles Randy S | $165,000 | Old Republic Title Company | |
| Tayaba Christine M | $315,000 | Fidelity National Title Co |
Source: Public Records
Mortgage History
| Date | Status | Borrower | Loan Amount |
|---|---|---|---|
| Open | Miles Randy S | $361,550 | |
| Closed | Miles Randy S | $159,101 | |
| Previous Owner | Tayaba Christine M | $299,250 |
Source: Public Records
Tax History Compared to Growth
Tax History
| Year | Tax Paid | Tax Assessment Tax Assessment Total Assessment is a certain percentage of the fair market value that is determined by local assessors to be the total taxable value of land and additions on the property. | Land | Improvement |
|---|---|---|---|---|
| 2025 | $4,320 | $203,177 | $60,953 | $142,224 |
| 2024 | $4,320 | $199,194 | $59,758 | $139,436 |
| 2023 | $4,438 | $195,288 | $58,586 | $136,702 |
| 2022 | $4,265 | $191,460 | $57,438 | $134,022 |
| 2021 | $3,957 | $187,707 | $56,312 | $131,395 |
| 2020 | $3,911 | $185,783 | $55,735 | $130,048 |
| 2019 | $3,688 | $182,141 | $54,642 | $127,499 |
| 2018 | $3,614 | $178,570 | $53,571 | $124,999 |
| 2017 | $3,447 | $175,068 | $52,520 | $122,548 |
| 2016 | $3,260 | $171,637 | $51,491 | $120,146 |
| 2015 | $3,240 | $169,060 | $50,718 | $118,342 |
| 2014 | $3,190 | $165,748 | $49,724 | $116,024 |
Source: Public Records
Map
Nearby Homes
- 2715 Macarthur Blvd
- 2726 Madeline St
- 3853 Rhoda Ave
- 3873 Coolidge Ave
- 3477 Boston Ave Unit 4
- 3875 Coolidge Ave
- 3826 Lincoln Ave
- 2958 Georgia St
- 2510 Delmer St
- 2941 Madeline St
- 2954 Delaware St
- 3316 Coolidge Ave
- 2808 Carmel St
- 3019 Florida St
- 2240 Macarthur Blvd
- 3055 Kansas St
- 3887 Forest Hill Ave
- 3847 Fruitvale Ave
- 4019 Rhoda Ave
- 3615 Rhoda Ave
- 3615 Rhoda Ave Unit 2
- 3615 Rhoda Ave Unit 3
- 3615 Rhoda Ave Unit 1
- 3605 Rhoda Ave
- 3621 Rhoda Ave
- 3553 Rhoda Ave
- 3631 Rhoda Ave
- 3604 Laguna Ave
- 3608 Laguna Ave
- 3606 Laguna Ave
- 3610 Laguna Ave
- 3610 Laguna Ave
- 3616 Laguna Ave
- 3600 Laguna Ave
- 3624 Laguna Ave
- 3545 Rhoda Ave
- 3637 Rhoda Ave
- 3614 Rhoda Ave
- 3604 Rhoda Ave