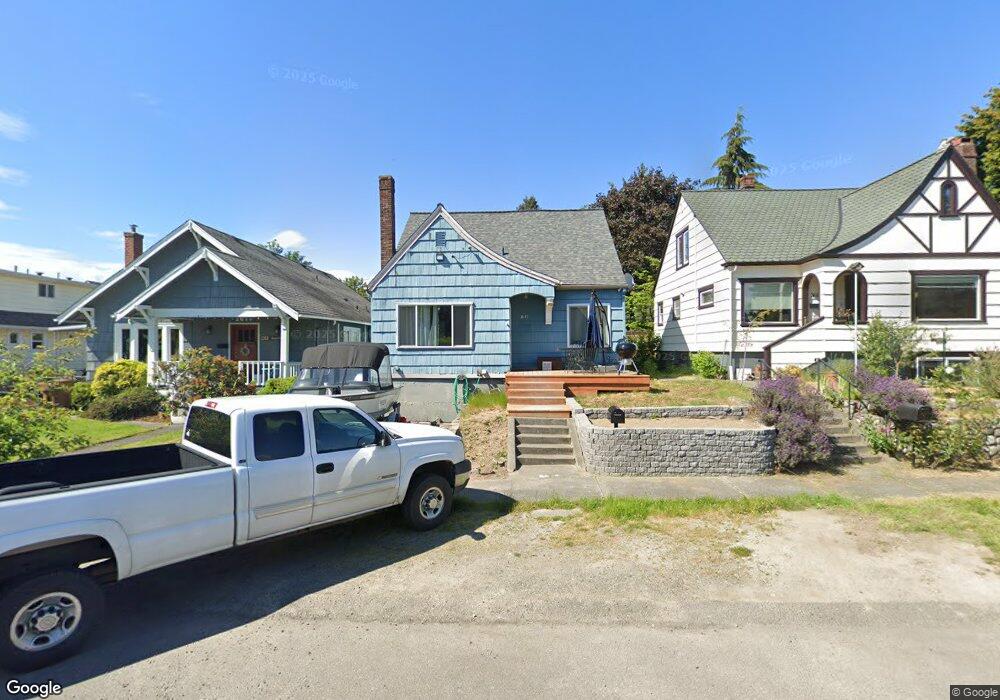
3615 S 8th St Tacoma, WA 98405
Central Tacoma NeighborhoodEstimated Value: $468,632 - $539,000
3
Beds
2
Baths
1,368
Sq Ft
$373/Sq Ft
Est. Value
About This Home
This home is located at 3615 S 8th St, Tacoma, WA 98405 and is currently estimated at $510,158, approximately $372 per square foot. 3615 S 8th St is a home located in Pierce County with nearby schools including Franklin Elementary School, Mason Middle School, and Foss High School.
Ownership History
Date
Name
Owned For
Owner Type
Purchase Details
Closed on
May 28, 2020
Sold by
Bishop Charlene M and Rennick Michael C
Bought by
Rennick Michael C and Rennick Charlene M
Current Estimated Value
Home Financials for this Owner
Home Financials are based on the most recent Mortgage that was taken out on this home.
Original Mortgage
$324,000
Outstanding Balance
$287,737
Interest Rate
3.3%
Mortgage Type
New Conventional
Estimated Equity
$222,421
Purchase Details
Closed on
Nov 8, 2008
Sold by
Bishop Charlene M and Bishop Charlene
Bought by
Bishop Charlene M and Rennick Michael C
Home Financials for this Owner
Home Financials are based on the most recent Mortgage that was taken out on this home.
Original Mortgage
$245,280
Interest Rate
6.07%
Mortgage Type
FHA
Purchase Details
Closed on
Jul 21, 1998
Sold by
Ab & J Funding Inc
Bought by
Bishop Charlene
Home Financials for this Owner
Home Financials are based on the most recent Mortgage that was taken out on this home.
Original Mortgage
$99,200
Interest Rate
6.9%
Purchase Details
Closed on
Sep 30, 1997
Sold by
Chindahl Margaret A
Bought by
Ab & J Funding Inc
Create a Home Valuation Report for This Property
The Home Valuation Report is an in-depth analysis detailing your home's value as well as a comparison with similar homes in the area
Home Values in the Area
Average Home Value in this Area
Purchase History
| Date | Buyer | Sale Price | Title Company |
|---|---|---|---|
| Rennick Michael C | -- | Cw Title | |
| Bishop Charlene M | $119,321 | Stewart Title | |
| Bishop Charlene | $124,000 | Chicago Title | |
| Ab & J Funding Inc | $68,640 | -- |
Source: Public Records
Mortgage History
| Date | Status | Borrower | Loan Amount |
|---|---|---|---|
| Open | Rennick Michael C | $324,000 | |
| Closed | Bishop Charlene M | $245,280 | |
| Previous Owner | Bishop Charlene | $99,200 | |
| Closed | Bishop Charlene | $18,600 |
Source: Public Records
Tax History Compared to Growth
Tax History
| Year | Tax Paid | Tax Assessment Tax Assessment Total Assessment is a certain percentage of the fair market value that is determined by local assessors to be the total taxable value of land and additions on the property. | Land | Improvement |
|---|---|---|---|---|
| 2025 | $4,638 | $434,500 | $225,600 | $208,900 |
| 2024 | $4,638 | $437,100 | $217,500 | $219,600 |
| 2023 | $4,638 | $416,500 | $209,300 | $207,200 |
| 2022 | $4,142 | $422,300 | $202,800 | $219,500 |
| 2021 | $3,923 | $312,000 | $128,900 | $183,100 |
| 2019 | $3,333 | $288,900 | $109,000 | $179,900 |
| 2018 | $3,519 | $256,300 | $95,500 | $160,800 |
| 2017 | $3,107 | $222,700 | $71,300 | $151,400 |
| 2016 | $2,734 | $167,900 | $52,000 | $115,900 |
| 2014 | $2,432 | $157,200 | $45,600 | $111,600 |
| 2013 | $2,432 | $142,800 | $42,900 | $99,900 |
Source: Public Records
Map
Nearby Homes
- 819 S Adams St
- 1002 S Washington St
- 3517 S 11th St
- 3515 S 11th St
- 3310 6th Ave Unit A-C
- 3606 S 12th St
- 3417 S 12th St
- 3820 S 12th St
- 3824 S 12th St
- 1231 S Washington St
- 3108 S 8th St
- 1301 S Durango St
- 4118 S 7th St
- 4111 6th Ave Unit A,B,C
- 1026 S Monroe St
- 1246 S Durango St
- 1404 S Adams St
- 4119 6th Ave
- 3107 N 7th St
- 616 N Junett St
- 3611 S 8th St
- 3617 S 8th St
- 3609 S 8th St
- 3623 S 8th St
- 3616 S 7th St
- 3612 S 7th St
- 707 S Washington St
- 3620 S 7th St
- 716 S Union Ave
- 712 S Union Ave
- 801 S Washington St
- 3610 S 7th St
- 3616 S 8th St
- 703 S Washington St
- 3610 S 8th St
- 805 S Washington St
- 3605 S 7th St
- 3701 S 8th St
- 3606 S 8th St
- 802 S Union Ave