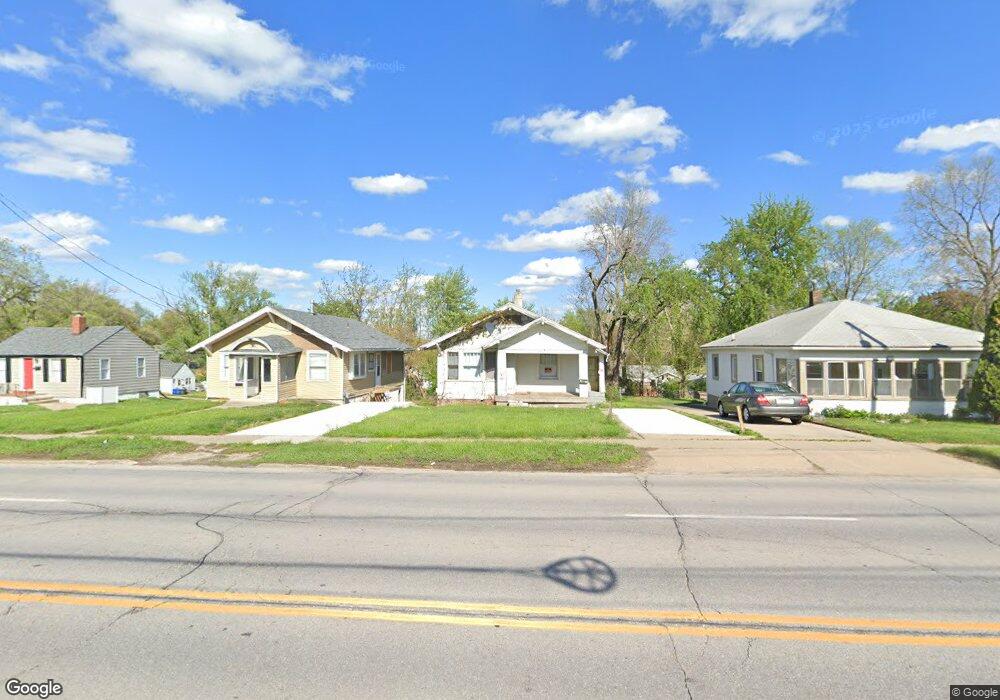
3615 SW 9th St Des Moines, IA 50315
Watrous Heights NeighborhoodEstimated Value: $134,076 - $165,000
2
Beds
1
Bath
868
Sq Ft
$173/Sq Ft
Est. Value
About This Home
This home is located at 3615 SW 9th St, Des Moines, IA 50315 and is currently estimated at $150,269, approximately $173 per square foot. 3615 SW 9th St is a home located in Polk County with nearby schools including Park Avenue Elementary School, Brody Middle School, and Lincoln High School.
Ownership History
Date
Name
Owned For
Owner Type
Purchase Details
Closed on
Nov 22, 2021
Sold by
Usman All
Bought by
Garman James
Current Estimated Value
Purchase Details
Closed on
Oct 5, 2021
Sold by
Garman James
Bought by
Usman Ali
Purchase Details
Closed on
Jun 23, 2017
Sold by
Maccleary Landon R
Bought by
Garman James
Home Financials for this Owner
Home Financials are based on the most recent Mortgage that was taken out on this home.
Original Mortgage
$25,000
Interest Rate
3.94%
Mortgage Type
Purchase Money Mortgage
Purchase Details
Closed on
Nov 14, 2005
Sold by
Maccleary Landon R
Bought by
Maccleary Landon R and Gire Barbara M
Home Financials for this Owner
Home Financials are based on the most recent Mortgage that was taken out on this home.
Original Mortgage
$64,900
Interest Rate
6%
Mortgage Type
Fannie Mae Freddie Mac
Purchase Details
Closed on
Nov 7, 2005
Sold by
Kearney Kent and Kearney Holly
Bought by
Maccleary Landon R
Home Financials for this Owner
Home Financials are based on the most recent Mortgage that was taken out on this home.
Original Mortgage
$64,900
Interest Rate
6%
Mortgage Type
Fannie Mae Freddie Mac
Create a Home Valuation Report for This Property
The Home Valuation Report is an in-depth analysis detailing your home's value as well as a comparison with similar homes in the area
Home Values in the Area
Average Home Value in this Area
Purchase History
| Date | Buyer | Sale Price | Title Company |
|---|---|---|---|
| Garman James | -- | None Available | |
| Usman Ali | $15,000 | None Available | |
| Garman James | $53,000 | None Available | |
| Maccleary Landon R | -- | -- | |
| Maccleary Landon R | $64,500 | -- |
Source: Public Records
Mortgage History
| Date | Status | Borrower | Loan Amount |
|---|---|---|---|
| Previous Owner | Garman James | $25,000 | |
| Previous Owner | Maccleary Landon R | $64,900 |
Source: Public Records
Tax History Compared to Growth
Tax History
| Year | Tax Paid | Tax Assessment Tax Assessment Total Assessment is a certain percentage of the fair market value that is determined by local assessors to be the total taxable value of land and additions on the property. | Land | Improvement |
|---|---|---|---|---|
| 2025 | $1,736 | $100,000 | $22,800 | $77,200 |
| 2024 | $1,736 | $88,200 | $20,100 | $68,100 |
| 2023 | $1,668 | $88,200 | $20,100 | $68,100 |
| 2022 | $1,841 | $70,800 | $16,500 | $54,300 |
| 2021 | $2,542 | $70,800 | $16,500 | $54,300 |
| 2020 | $2,196 | $62,600 | $14,700 | $47,900 |
| 2019 | $1,486 | $62,600 | $14,700 | $47,900 |
| 2018 | $1,150 | $55,300 | $12,800 | $42,500 |
| 2017 | $1,032 | $55,300 | $12,800 | $42,500 |
| 2016 | $2,144 | $49,900 | $11,500 | $38,400 |
| 2015 | $998 | $49,900 | $11,500 | $38,400 |
| 2014 | $954 | $49,600 | $11,300 | $38,300 |
Source: Public Records
Map
Nearby Homes
- 3605 SW 9th St
- 3618 SW 9th St
- 915 Wolcott Ave
- 3903 SW 9th St
- 3308 SW 7th St
- 410 Thornton Ave
- 3514 SW 12th St
- 3325 SW 5th St
- 3824 SW 12th St
- 606 Marion St
- 3808 SW 12th St
- 3621 SW 3rd St
- 300 Hughes Ave
- 3811 SW 3rd St
- 4204 SW 7th St
- 3503 SW 2nd St
- 3724 SW 13th St
- 1222 Watrous Ave
- 4020 SW 12th St
- 1230 Park Ave
- 3619 SW 9th St
- 3609 SW 9th St
- 3623 SW 9th St
- 0 Outlot X Community at Arbor Lake Plat 1
- 3612 SW 8th St
- 3627 SW 9th St
- 3620 SW 8th St
- 3624 SW 8th St
- 800 Thornton Ave
- 3701 SW 9th St
- 3612 SW 9th St
- 3700 SW 8th St
- 3608 SW 9th St
- 3620 SW 9th St
- 3600 SW 9th St
- 3525 SW 9th St
- 3704 SW 8th St
- 809 Thornton Ave
- 3611 SW 8th St
- 905 Wolcott Ave