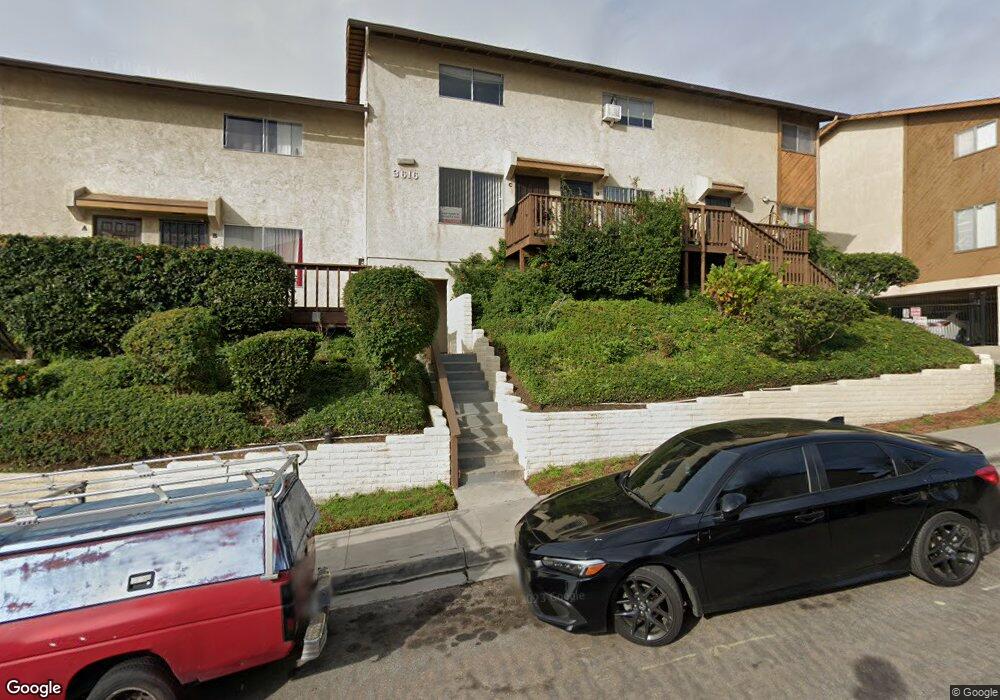
3616 Lemona Ave Unit E San Diego, CA 92105
Chollas Creek NeighborhoodEstimated Value: $404,000 - $453,000
2
Beds
2
Baths
1,120
Sq Ft
$390/Sq Ft
Est. Value
About This Home
This home is located at 3616 Lemona Ave Unit E, San Diego, CA 92105 and is currently estimated at $436,427, approximately $389 per square foot. 3616 Lemona Ave Unit E is a home located in San Diego County with nearby schools including Marshall Elementary School, Mann Middle School, and Crawford High School.
Ownership History
Date
Name
Owned For
Owner Type
Purchase Details
Closed on
Mar 8, 2000
Sold by
Schuster Paul C and Schuster Erica C
Bought by
Montoya Beverly C
Current Estimated Value
Home Financials for this Owner
Home Financials are based on the most recent Mortgage that was taken out on this home.
Original Mortgage
$60,000
Outstanding Balance
$20,349
Interest Rate
8.3%
Estimated Equity
$416,078
Purchase Details
Closed on
Apr 28, 1999
Sold by
Schuster Paul C and Hancock Erica C
Bought by
Schuster Paul C and Schuster Erica C
Purchase Details
Closed on
Sep 15, 1995
Sold by
Hud
Bought by
Schuster Paul C and Hancock Erica C
Home Financials for this Owner
Home Financials are based on the most recent Mortgage that was taken out on this home.
Original Mortgage
$56,294
Interest Rate
7.97%
Mortgage Type
FHA
Purchase Details
Closed on
Feb 3, 1995
Sold by
Jaouhar Naji Z and Jaouhar Milburga F
Bought by
Barclaysamerican Mtg Corp
Purchase Details
Closed on
Aug 10, 1990
Create a Home Valuation Report for This Property
The Home Valuation Report is an in-depth analysis detailing your home's value as well as a comparison with similar homes in the area
Home Values in the Area
Average Home Value in this Area
Purchase History
| Date | Buyer | Sale Price | Title Company |
|---|---|---|---|
| Montoya Beverly C | $80,000 | Lawyers Title | |
| Schuster Paul C | -- | American Title Company | |
| Schuster Paul C | $57,000 | California Coast Title | |
| Barclaysamerican Mtg Corp | $79,908 | Northern Counties Title Ins | |
| -- | $72,500 | -- |
Source: Public Records
Mortgage History
| Date | Status | Borrower | Loan Amount |
|---|---|---|---|
| Open | Montoya Beverly C | $60,000 | |
| Previous Owner | Schuster Paul C | $56,294 | |
| Closed | Montoya Beverly C | $16,000 |
Source: Public Records
Tax History Compared to Growth
Tax History
| Year | Tax Paid | Tax Assessment Tax Assessment Total Assessment is a certain percentage of the fair market value that is determined by local assessors to be the total taxable value of land and additions on the property. | Land | Improvement |
|---|---|---|---|---|
| 2025 | $1,426 | $122,944 | $35,900 | $87,044 |
| 2024 | $1,426 | $120,535 | $35,197 | $85,338 |
| 2023 | $1,393 | $118,172 | $34,507 | $83,665 |
| 2022 | $1,354 | $115,856 | $33,831 | $82,025 |
| 2021 | $1,344 | $113,585 | $33,168 | $80,417 |
| 2020 | $1,327 | $112,421 | $32,828 | $79,593 |
| 2019 | $1,302 | $110,218 | $32,185 | $78,033 |
| 2018 | $1,217 | $108,057 | $31,554 | $76,503 |
| 2017 | $83 | $105,939 | $30,936 | $75,003 |
| 2016 | $1,165 | $103,863 | $30,330 | $73,533 |
| 2015 | $1,147 | $102,304 | $29,875 | $72,429 |
| 2014 | $1,129 | $100,301 | $29,290 | $71,011 |
Source: Public Records
Map
Nearby Homes
- 3636 Lemona Ave Unit B
- 5055 University Ave Unit a1
- 5341 Rex Ave
- 5310 Rex Ave Unit 1
- 4888 Auburn Dr
- 4013 Oakcrest Dr Unit 3
- 5426 Dwight St
- 3416 Winlow St
- 4792 Dwight St
- 4837 Castle Ave
- 4041 Oakcrest Dr Unit 207
- 4041 Oakcrest Dr Unit 105
- 5474 Streamview Dr
- 3518-3520 Euclid Ave E
- 5506 University Ave
- 5432 Zeil Place
- 5700 Bates St Unit 6
- 4769 Thorn St
- 5566 Streamview Dr
- 4863 Polk Ave
- 3616 Lemona Ave Unit D
- 3616 Lemona Ave Unit C
- 3616 Lemona Ave Unit B
- 3616 Lemona Ave Unit A
- 3636 Lemona Ave
- 3636 Lemona Ave Unit G
- 3636 Lemona Ave Unit F
- 3636 Lemona Ave Unit E
- 3636 Lemona Ave Unit D
- 3636 Lemona Ave Unit C
- 3636 Lemona Ave Unit A
- 3626 Lemona Ave Unit F
- 3626 Lemona Ave Unit E
- 3626 Lemona Ave Unit D
- 3626 Lemona Ave Unit C
- 3626 Lemona Ave Unit B
- 3626 Lemona Ave Unit A
- 3619 51st St
- 3627 51st St
- 3611 51st St