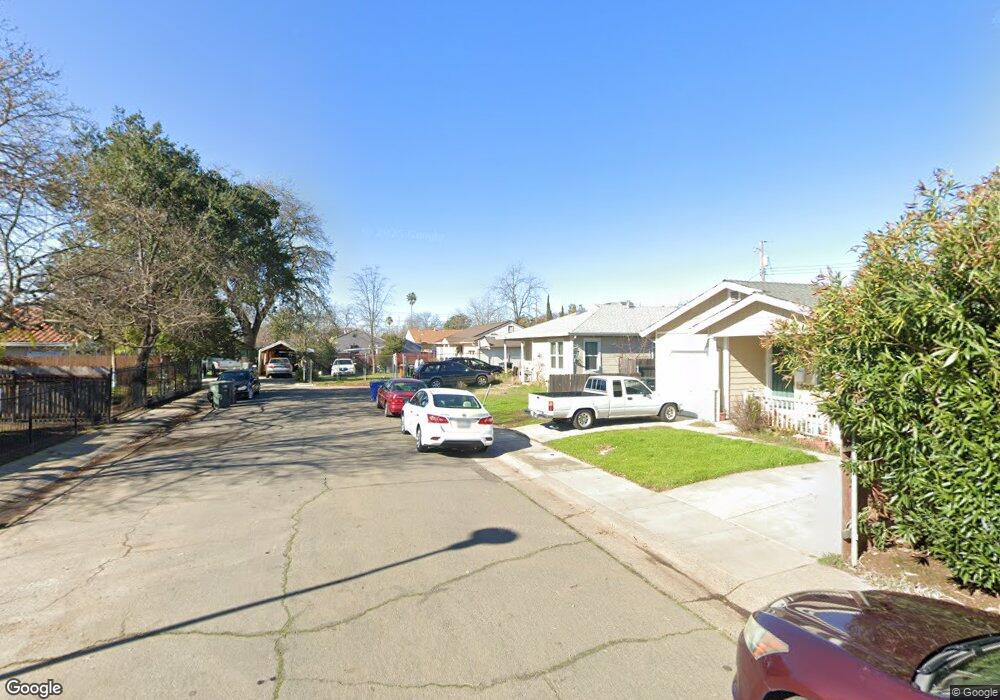
3617 17th Ave Sacramento, CA 95820
South Oak Park NeighborhoodEstimated Value: $245,000 - $320,146
2
Beds
1
Bath
936
Sq Ft
$319/Sq Ft
Est. Value
About This Home
This home is located at 3617 17th Ave, Sacramento, CA 95820 and is currently estimated at $298,287, approximately $318 per square foot. 3617 17th Ave is a home located in Sacramento County with nearby schools including Oak Ridge Elementary School, California Middle, and Hiram W. Johnson High School.
Ownership History
Date
Name
Owned For
Owner Type
Purchase Details
Closed on
Jul 25, 2017
Sold by
Brooks Vaughan Tammy and Brooks Murry Tammy
Bought by
Vaughan Tammy
Current Estimated Value
Home Financials for this Owner
Home Financials are based on the most recent Mortgage that was taken out on this home.
Original Mortgage
$75,000
Outstanding Balance
$62,347
Interest Rate
3.91%
Mortgage Type
New Conventional
Estimated Equity
$235,940
Purchase Details
Closed on
Jun 26, 2015
Sold by
Vairee Vaughan Revocable Living Trust
Bought by
Murry Tammy Brooks
Purchase Details
Closed on
Feb 10, 2011
Sold by
Vaughan Vairee
Bought by
Vairee Vaughan Revocable Living Trust
Create a Home Valuation Report for This Property
The Home Valuation Report is an in-depth analysis detailing your home's value as well as a comparison with similar homes in the area
Home Values in the Area
Average Home Value in this Area
Purchase History
| Date | Buyer | Sale Price | Title Company |
|---|---|---|---|
| Vaughan Tammy | -- | Fidelity National Title Comp | |
| Murry Tammy Brooks | -- | None Available | |
| Vairee Vaughan Revocable Living Trust | -- | None Available |
Source: Public Records
Mortgage History
| Date | Status | Borrower | Loan Amount |
|---|---|---|---|
| Open | Vaughan Tammy | $75,000 |
Source: Public Records
Tax History Compared to Growth
Tax History
| Year | Tax Paid | Tax Assessment Tax Assessment Total Assessment is a certain percentage of the fair market value that is determined by local assessors to be the total taxable value of land and additions on the property. | Land | Improvement |
|---|---|---|---|---|
| 2025 | $1,333 | $106,953 | $46,266 | $60,687 |
| 2024 | $1,333 | $104,857 | $45,359 | $59,498 |
| 2023 | $1,300 | $102,802 | $44,470 | $58,332 |
| 2022 | $1,275 | $100,788 | $43,599 | $57,189 |
| 2021 | $1,216 | $98,813 | $42,745 | $56,068 |
| 2020 | $1,221 | $97,801 | $42,307 | $55,494 |
| 2019 | $2,306 | $95,884 | $41,478 | $54,406 |
| 2018 | $1,704 | $94,005 | $40,665 | $53,340 |
| 2017 | $1,143 | $92,163 | $39,868 | $52,295 |
| 2016 | $1,095 | $90,357 | $39,087 | $51,270 |
| 2015 | $625 | $43,892 | $22,991 | $20,901 |
| 2014 | $611 | $43,033 | $22,541 | $20,492 |
Source: Public Records
Map
Nearby Homes