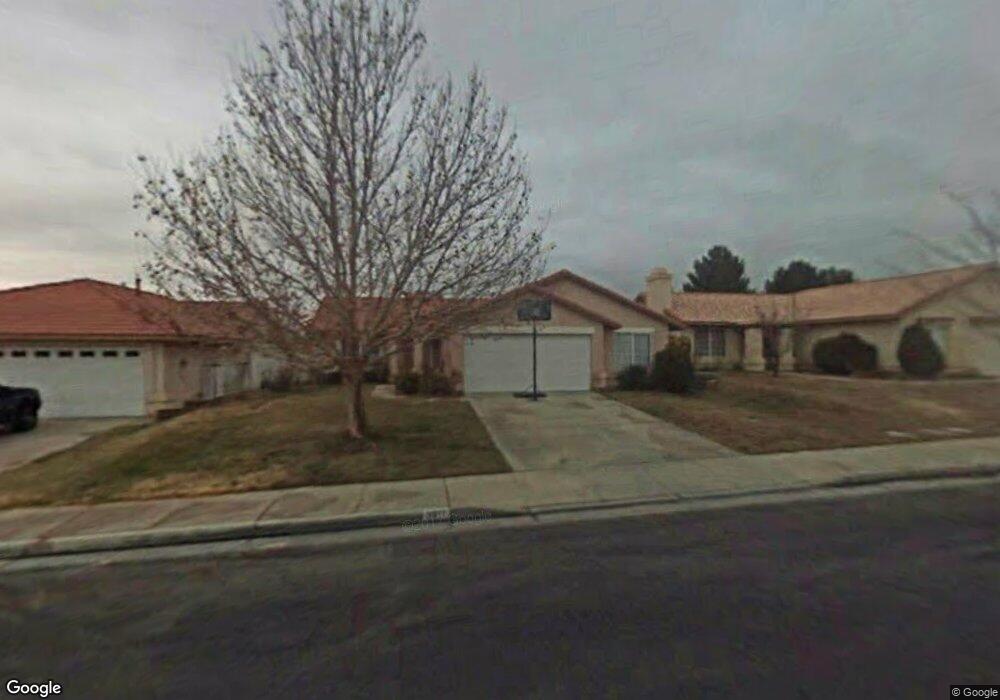
3617 Scherer Dr Rosamond, CA 93560
Estimated Value: $388,224 - $399,000
3
Beds
2
Baths
1,520
Sq Ft
$259/Sq Ft
Est. Value
About This Home
This home is located at 3617 Scherer Dr, Rosamond, CA 93560 and is currently estimated at $393,806, approximately $259 per square foot. 3617 Scherer Dr is a home located in Kern County.
Ownership History
Date
Name
Owned For
Owner Type
Purchase Details
Closed on
Feb 3, 2009
Sold by
Hsbc Bank Usa National Association
Bought by
Coffey Brian and Coffey Tiffany
Current Estimated Value
Home Financials for this Owner
Home Financials are based on the most recent Mortgage that was taken out on this home.
Original Mortgage
$104,802
Outstanding Balance
$66,177
Interest Rate
5.08%
Mortgage Type
FHA
Estimated Equity
$327,629
Purchase Details
Closed on
Sep 11, 2008
Sold by
Casillas Griselda Rosas
Bought by
Hsbc Bank Usa Na
Purchase Details
Closed on
Jun 14, 2006
Sold by
Martin William B and The William B Martin 1992 Trus
Bought by
Casillas Griselda Rosas
Home Financials for this Owner
Home Financials are based on the most recent Mortgage that was taken out on this home.
Original Mortgage
$257,400
Interest Rate
7.87%
Mortgage Type
Purchase Money Mortgage
Create a Home Valuation Report for This Property
The Home Valuation Report is an in-depth analysis detailing your home's value as well as a comparison with similar homes in the area
Home Values in the Area
Average Home Value in this Area
Purchase History
| Date | Buyer | Sale Price | Title Company |
|---|---|---|---|
| Coffey Brian | $113,000 | Lsi Title Company Ca | |
| Hsbc Bank Usa Na | $106,500 | Accommodation | |
| Casillas Griselda Rosas | $286,000 | Fatcola |
Source: Public Records
Mortgage History
| Date | Status | Borrower | Loan Amount |
|---|---|---|---|
| Open | Coffey Brian | $104,802 | |
| Previous Owner | Casillas Griselda Rosas | $257,400 |
Source: Public Records
Tax History Compared to Growth
Tax History
| Year | Tax Paid | Tax Assessment Tax Assessment Total Assessment is a certain percentage of the fair market value that is determined by local assessors to be the total taxable value of land and additions on the property. | Land | Improvement |
|---|---|---|---|---|
| 2025 | $3,315 | $145,498 | $45,062 | $100,436 |
| 2024 | $3,192 | $142,646 | $44,179 | $98,467 |
| 2023 | $3,192 | $139,850 | $43,313 | $96,537 |
| 2022 | $3,055 | $137,109 | $42,464 | $94,645 |
| 2021 | $2,894 | $134,422 | $41,632 | $92,790 |
| 2020 | $2,839 | $133,045 | $41,206 | $91,839 |
| 2019 | $1,943 | $133,045 | $41,206 | $91,839 |
| 2018 | $1,894 | $127,881 | $39,607 | $88,274 |
| 2017 | $1,864 | $125,375 | $38,831 | $86,544 |
| 2016 | $1,789 | $122,918 | $38,070 | $84,848 |
| 2015 | $2,053 | $121,073 | $37,499 | $83,574 |
| 2014 | $2,380 | $118,702 | $36,765 | $81,937 |
Source: Public Records
Map
Nearby Homes
- 3649 Scherer Dr
- 1208 Oakwood Ln
- 3717 Hatcher Place
- 3533 Fernwood St
- 3300 15th St W Unit 358
- 3300 15th St W Unit Spc 155
- 3300 15th St W Unit 182
- 3300 15th St W Unit 355
- 3300 15th St W Unit Spc 230
- 3300 15th St W Unit Spc 59
- 3300 15th St W Unit 371
- 3300 15th St W Unit 133 133
- 3300 15th St W Unit 254
- 3300 15th St W Unit 361
- 3300 15th St W Unit 272
- 3300 15th St W
- 3300 W 15th Street West St Unit 264
- 3840 Hatcher Place
- 1164 Barrington Ave
- 1016 Armstrong Ave
- 3625 Scherer Dr
- 3633 Scherer Dr
- 3601 Scherer Dr
- 1316 Westview Ln
- 1248 Oakwood Ln
- 3624 Scherer Dr
- 3641 Scherer Dr
- 1324 Westview Ln
- 3632 Scherer Dr
- 3640 Gainsborough Ct
- 1240 Oakwood Ln
- 1332 Westview Ln
- 3640 Scherer Dr
- 3625 Lyons Dr
- 1232 Oakwood Ln
- 3648 Gainsborough Ct
- 3648 Scherer Dr
- 3657 Scherer Dr
- 3633 Lyons Dr
- 1340 Westview Ln