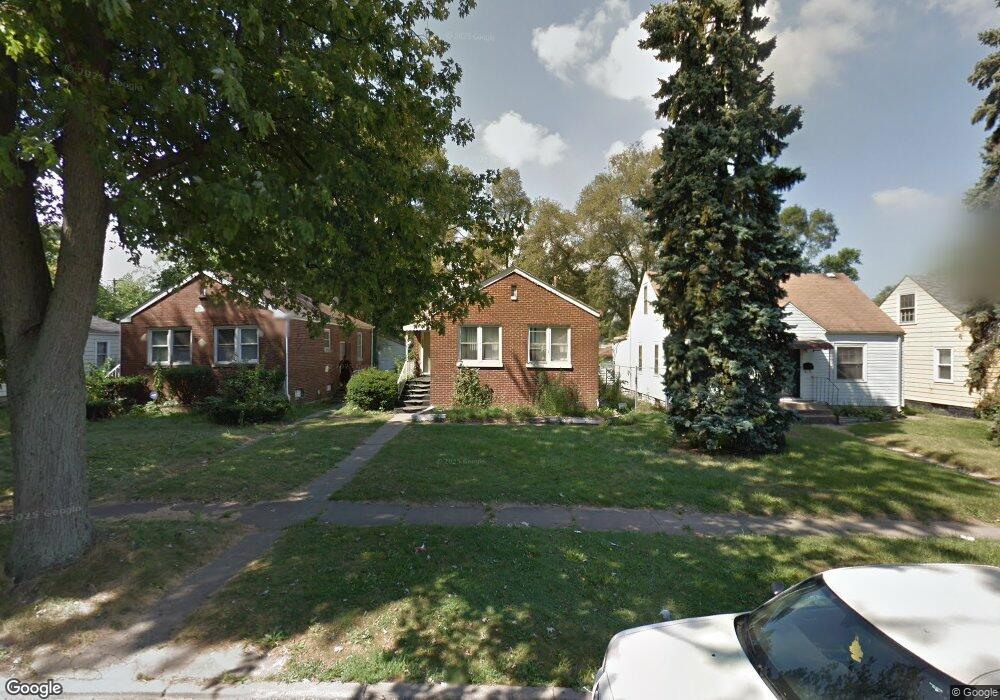
3618 Buchanan St Gary, IN 46408
Glen Park NeighborhoodEstimated Value: $70,000 - $147,000
3
Beds
1
Bath
1,776
Sq Ft
$61/Sq Ft
Est. Value
About This Home
This home is located at 3618 Buchanan St, Gary, IN 46408 and is currently estimated at $107,977, approximately $60 per square foot. 3618 Buchanan St is a home located in Lake County with nearby schools including Glen Park Academy for Excellence in Learning, Bailly Preparatory Academy, and West Side Leadership Academy.
Ownership History
Date
Name
Owned For
Owner Type
Purchase Details
Closed on
Jan 22, 2019
Sold by
Sturt Cheryl
Bought by
Antunez Carla M
Current Estimated Value
Purchase Details
Closed on
Feb 21, 2018
Sold by
Reo Logic Indiana Holdings Llc
Bought by
Ibat Holdings In Llc
Purchase Details
Closed on
Sep 22, 2017
Sold by
Reon Logic Indiana Hodlings Llc
Bought by
Sturt Cheryl
Purchase Details
Closed on
Aug 27, 2015
Sold by
Us Bank Llc
Bought by
Rec Loggic Indiana Holdings Llc
Purchase Details
Closed on
Jul 7, 2015
Sold by
As Good As It Tets Llc
Bought by
Us Bank
Purchase Details
Closed on
Feb 14, 2005
Sold by
Mccune Simon J P
Bought by
As Good As It Gets Llc
Home Financials for this Owner
Home Financials are based on the most recent Mortgage that was taken out on this home.
Original Mortgage
$61,300
Interest Rate
1.4%
Mortgage Type
Fannie Mae Freddie Mac
Create a Home Valuation Report for This Property
The Home Valuation Report is an in-depth analysis detailing your home's value as well as a comparison with similar homes in the area
Home Values in the Area
Average Home Value in this Area
Purchase History
| Date | Buyer | Sale Price | Title Company |
|---|---|---|---|
| Antunez Carla M | $3,500 | None Available | |
| Ibat Holdings In Llc | -- | None Available | |
| Sturt Cheryl | $3,500 | None Available | |
| Rec Loggic Indiana Holdings Llc | -- | None Available | |
| Us Bank | $3,138 | None Available | |
| As Good As It Gets Llc | -- | Chicago Title Insurance Comp |
Source: Public Records
Mortgage History
| Date | Status | Borrower | Loan Amount |
|---|---|---|---|
| Previous Owner | As Good As It Gets Llc | $61,300 |
Source: Public Records
Tax History
| Year | Tax Paid | Tax Assessment Tax Assessment Total Assessment is a certain percentage of the fair market value that is determined by local assessors to be the total taxable value of land and additions on the property. | Land | Improvement |
|---|---|---|---|---|
| 2025 | $1,240 | $78,900 | $5,300 | $73,600 |
| 2024 | $3,968 | $72,600 | $5,300 | $67,300 |
| 2023 | $1,120 | $45,000 | $5,100 | $39,900 |
| 2022 | $1,120 | $43,700 | $4,000 | $39,700 |
| 2021 | $1,035 | $40,400 | $4,000 | $36,400 |
| 2020 | $989 | $38,600 | $4,000 | $34,600 |
| 2019 | $775 | $33,500 | $4,000 | $29,500 |
| 2018 | $974 | $35,500 | $4,200 | $31,300 |
| 2017 | $881 | $35,900 | $4,200 | $31,700 |
| 2016 | $899 | $42,200 | $4,200 | $38,000 |
| 2014 | $1,371 | $58,600 | $4,900 | $53,700 |
| 2013 | $1,292 | $57,500 | $4,900 | $52,600 |
Source: Public Records
Map
Nearby Homes
- 3636 Lincoln St
- 3679 Buchanan St
- 3701 Grant St
- 3816 Lincoln St
- 3752 Tyler St
- 3756 Tyler St
- 1301 W Ridge Rd
- 3634 Van Buren St
- 3940 Pierce St
- 3771 Van Buren St
- 4151 Harrison St
- 3701 Monroe St
- 4034 Fillmore St
- 1645 W 40th Ave
- 519 W 39th Ave
- 3916 Monroe St
- 200 W 36th Place
- 3953 Monroe St
- 3825 Taft St
- 4056 Cleveland St
- 3624 Buchanan St
- 3612 Buchanan St
- 3606 Buchanan St
- 3630 Buchanan St
- 3600 Buchanan St
- 3619 Lincoln St
- 3625 Lincoln St
- 3642 Buchanan St
- 3607 Lincoln St
- 3619 Buchanan St
- 3613 Buchanan St
- 3625 Buchanan St
- 3601 Lincoln St
- 3607 Buchanan St
- 3648 Buchanan St
- 3643 Lincoln St
- 3633 Buchanan St
- 3601 Buchanan St
- 3649 Lincoln St
- 3643 Buchanan St
Your Personal Tour Guide
Ask me questions while you tour the home.